Service Level Indicators
Introduction to SLI, examples, counterexamples and tips
In why bother with SLI and SLO we discussed why service levels are important. This article focuses on SLI and a follow up will discuss SLO.
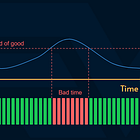
A Service Level Indicator (SLI) is a reliability metric that shows the percentage of perceived good in a period of time and defines the service owners’ commitment towards service consumers.
Let’s unpack that:
SLI is a metric: it goes up and down. On its own SLI cannot tell if the system is reliable or not. We need the Service Level Objective (SLO) to know what we promised and where do we stand in relation to that promise.
SLI is a reliability metric: there are many metrics that can indicate the behavior of a system or group of systems. SLI is particularly focused on the reliability aspect. For example: MAU (monthly active users) of a system may be a great product metric but it is not a reliability metric. Sure, the reliability can impact the MAU, but the two metrics have fundamentally different audiences and control mechanisms. SLI caters towards engineers who build a solution.
SLI is concerned with perceived reliability: SLI is set at the boundaries of your service towards its consumers. For example, if you offer an API to your users, they may perceive its reliability by its latency, error rate, or other metrics, but they don’t care and shouldn’t be concerned with how your API is built behind the scenes. As far as they are concerned, your service is a black box to them and it’s not up to them how you design it. This gives freedom to the service owners to truly own all aspects of the system.
SLI ties to alerting: SLI defines what we measure and SLO sets a target for it while alerts are ultimately set after the SLOs to communicate the service owners’ accountability towards the service consumers.
SLI is a percentage: as we’ll see the formula for SLI indicates the percentage of good in a set of values that are in the scope of optimization (valid). Therefore, the value of the SLI is always from 0 to 100. Although technically any raw metric can be considered an SLI, Google (where these ideas originated from “generally recommend treating the SLI as the ratio of two numbers” (reference).
SLI is positive: SLI is concerned with good, not bad. For example, instead of focusing on error rate, SLI is concerned with the success rate. For the opposite view, please see the error budgets.
SLI is aggregated over a period of time: Unlike many real-time metrics like CPU usage, SLI aggregates the values over a period of time. This aggregation is a very powerful concept as it allows for failure (error budget) in a controlled manner. The time period attribute (also known as the compliance period) is an attribute of the SLO.
Formula
The formula for SLI is very simple:
The formula is the same whether we’re counting events (good events / valid events) or time slots (good time slots / valid time slots).
Valid is often simplified to total
We have covered these in detail before:
Example: Event based
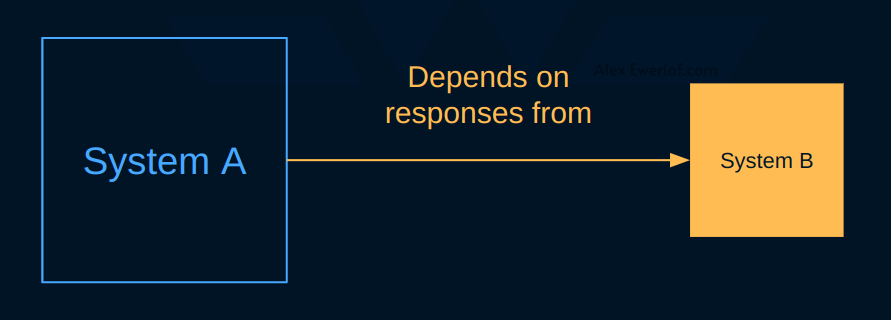
Let’s imagine that we have two systems. They can be a front-end and backend, or two microservices, or a backend and database, or something else. It can’t get simpler than that! One system depends on the other.
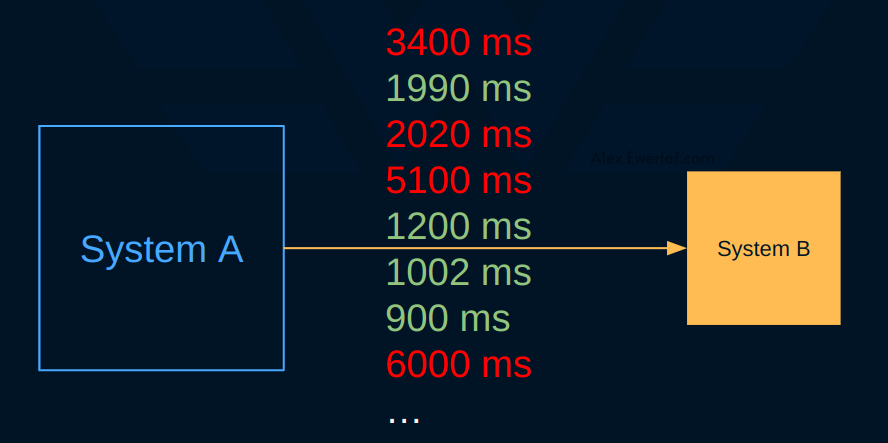
Let’s say that the response latency is critical for system A. The owners of system A want the owners of system B to be responsible for a good latency. More specifically, they want the latency to be below 2000ms.
Here are some example latencies:
The ones in red are above the 2000ms threshold. Drawing the same numbers on a diagram, we get this:
The formula for SLI is:
In this example, we have 8 response latencies where 4 of them are responded in good time (less than 2000ms). The SLI in this particular period is:
Let’s use some numbers that are more realistic:
In a month, we get 1,000,300 requests
992,300 of them were responded in less than 2000ms
Example: Time based
Let’s say that the reliability of system B is measured by uptime. Its endpoint is probed every minute and we get this data:
SLI is the number of bad probes (or bad minutes) divided by the total number of probes (or the minutes in the measurement window). In this example, 28 out of 36 probes succeeded:
Uptime is a common SLI. You may have seen this type of diagram for other products. For example status.brave.com looks like this:
Common SLIs
Here’s a list of the most common SLIs:
Availability: the fraction of the time that a service is reachable
Success rate: The percentage of requests that are successful (the opposite of Error Rate, but in SLI formula we focus on Good/Valid)
Latency: how long it takes to return a response to a request or do a computation
Latency and response time can be different things: Latency versus Response Time | Scalable Developer
Throughput: The number of requests that can be processed per unit of time. Typically measured in requests per second, messages consumed (e.g. useful for queue-based workers), queries processed (e.g. for Databases), volume of logs ingested (e.g. for data processing systems)
Saturation: The percentage of resources that are being used. Note that this can easily be a vanity metric. If the SLI does not map to how reliability is perceived from the service consumers point of view, it’s not a good indicator. A counter-example is client applications. For example, if the CPU/Memory usage of a mobile or web app is too high, it may impact the UX and you may want to set an object to reduce those numbers. You can use time-based (e.g. number of minutes where the users pace CPU usage is below 60%) or event-based (e.g. amount of memory consumed per opened file).
Durability: the likelihood that data will be retained over a long period of time (useful for data integrity)
What is not a good SLI?
SLI indicates how reliability is perceived from the service consumers’ perspective. In a future article we will discuss 🔴what makes a good SLI.
SLIs primarily concern engineers responsible for the technical solution, not how the product performs. 🔴SLI is not KPI.
Most metrics are an aggregation of multiple variables. An engineering team doesn’t control all those variables. Therefore, we have to dig a layer deeper to find the part of the metric that is controlled by a specific part of the organization that owns it and is expected to commit to a SLI.
You should only be accountable for what you control. The reverse is also true: you should control what you’re held accountable for.
Example for good metrics that are bad SLIs:
Number of items sold per month (engineers don’t control user demand or purchase power)
Team health metrics from tools like OfficeVibe: assuming the EM has the mandate and accountability to shape the team health, this is an organizational metric.
CPU/RAM/Net/Disk usage: SLI ties to SLO which in turn ties to Alert which ties to on-call. If it doesn't worth waking someone up in the middle of the night, it’s not a good SLI. It may be a great metric to do root cause analysis once the incident happens, but alone, it’s not something to optimize unless we have insight that this is in fact the metric that defines how consumers perceive reliability.
User Satisfaction Survey: this is a great metric but not something that is completely under the control of the engineering team in the scope of system reliability. User satisfaction may be impacted by things that are outside the control of the engineers responsible for the technical solution.
Conversion rate: again, this is a metric that is primarily controlled by marketing, UX and design and not all parameters that can affect the conversion is under control of the engineers.
Test coverage: does not measure system reliability as the users perceive it. A system with poor test coverage that has an uptime above expectation is good. Another system with 100% test coverage which suffers from poor latency (assuming that latency is the SLI), is not good.
Pro-Tips
These posts take anything from a few hours to days to draft, research, edit, illustrate, and publish. The main chunk of the article is available for free. 🔓 For those who spare a few bucks, the “pro tips” unlocked as a token of appreciation (Right now, you can get 20% off via this link). And for those who choose not to subscribe, it is fine too. I appreciate your time reading this far and hopefully you share it withing your circles to inspire others. 🙏You can also follow me on LinkedIn where I share useful tips about technical leadership and growth mindset.


