

SLI Compass: Fidelity and Granularity
A Mental Model to Assess Existing SLIs and Evaluate New Ones

Service Level Indicator (SLIs) is a fundamental concept in reliability engineering. Done right, it quantifies the level of service from the consumer’s point of view in line with the business objectives.
However, different SLIs have different signal to noise ratio and ROI (return on investment).
This article introduces SLI Compass, a 2D mental model to help you:
Quickly assess the signal/noise ratio of existing SLIs
Evaluate SLIs based on their cost and complexity
Set a direction for improving the quality of existing SLIs at a reasonable ROI
The goal is to help senior engineers, technical and engineering leaders to pick the right SLI based on product maturity, budget, timing, and usage patterns.
Categorizing SLIs
I’ve gone through hundreds of architectures with tens of teams over the years both at my companies and external clients.
In my experience the most common SLIs are:
Availability: is the service available to the consumer and can it be used for their tasks? This is by far the most common SLI except for async services like queues where other metrics make more sense.
Latency: how long does it take to interact with the service? This is very common for user-facing services, or services that have a time-critical consumption like Frontend, API, Databases, CDN, queued workload processing, etc.
Success rate: how often do consumers manage to fulfill their task? This is common with transactional services like REST APIs, user journeys, or even queued workload (e.g. dead-letter queue).
Efficiency: is the service operating with the right trade-offs that makes business sense? For example: are we using too much GPU for free user requests? Is the Cache being utilized? Are queued work being processed? etc.
There are also other niche metrics like correctness, freshness, relevance, etc.
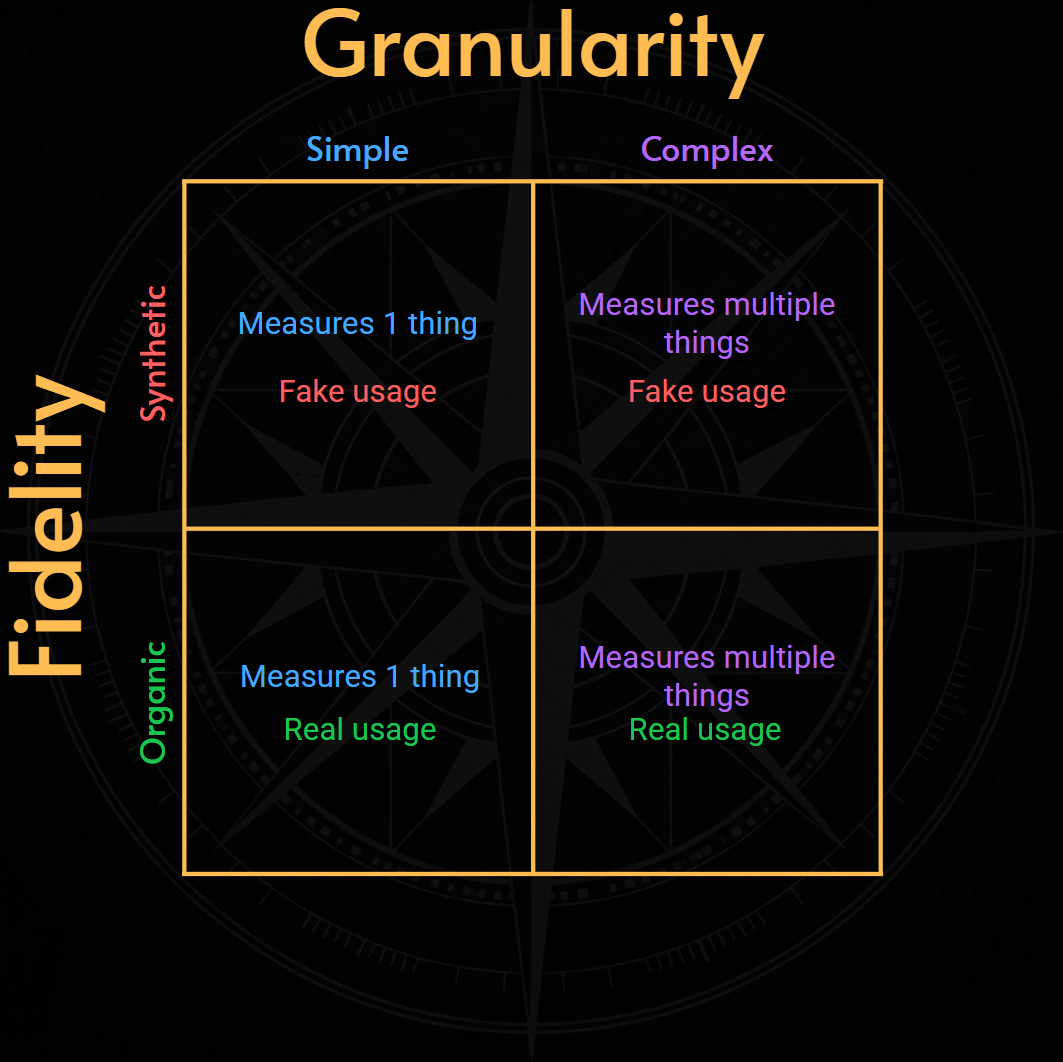
All SLIs can be mapped in a 2D axis:
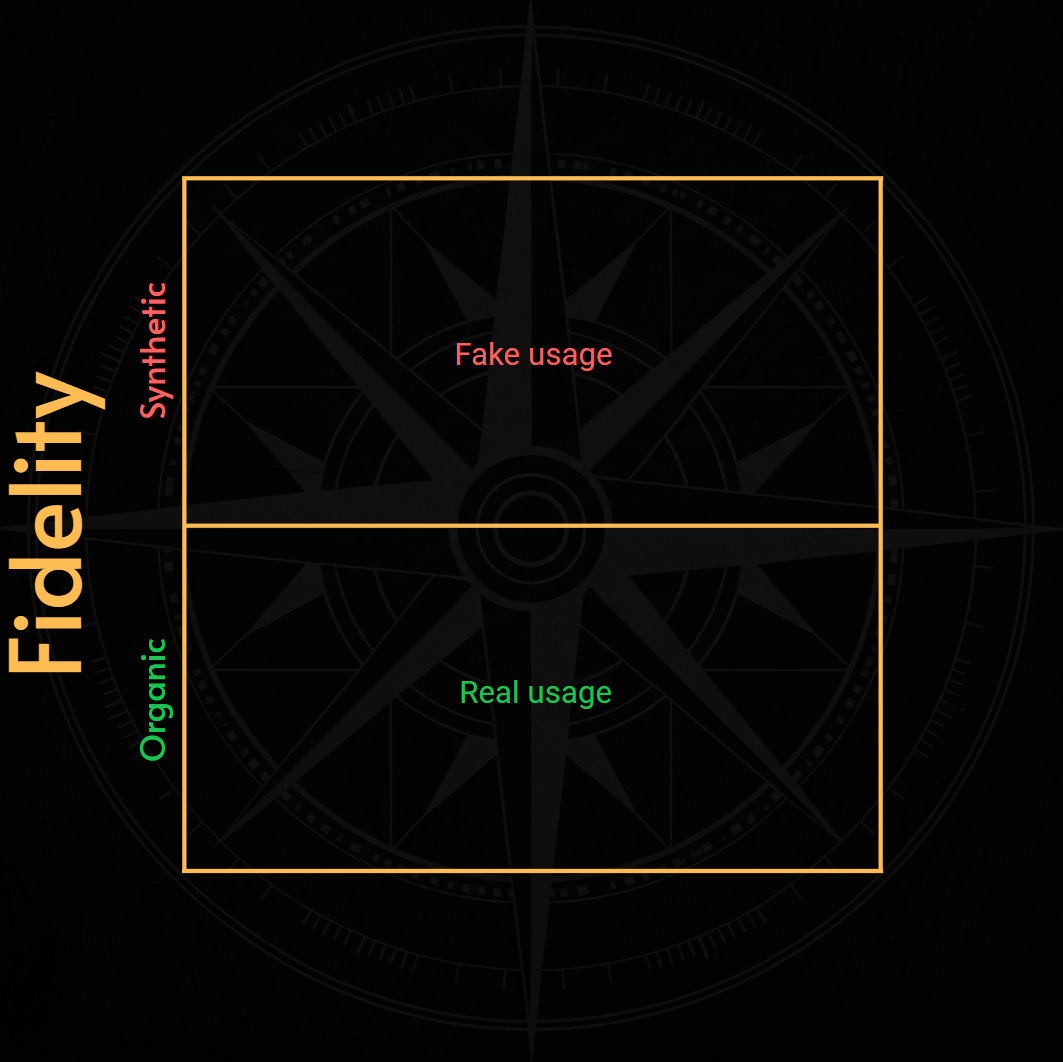
Fidelity: how closely does the SLI represent the consumer experience?
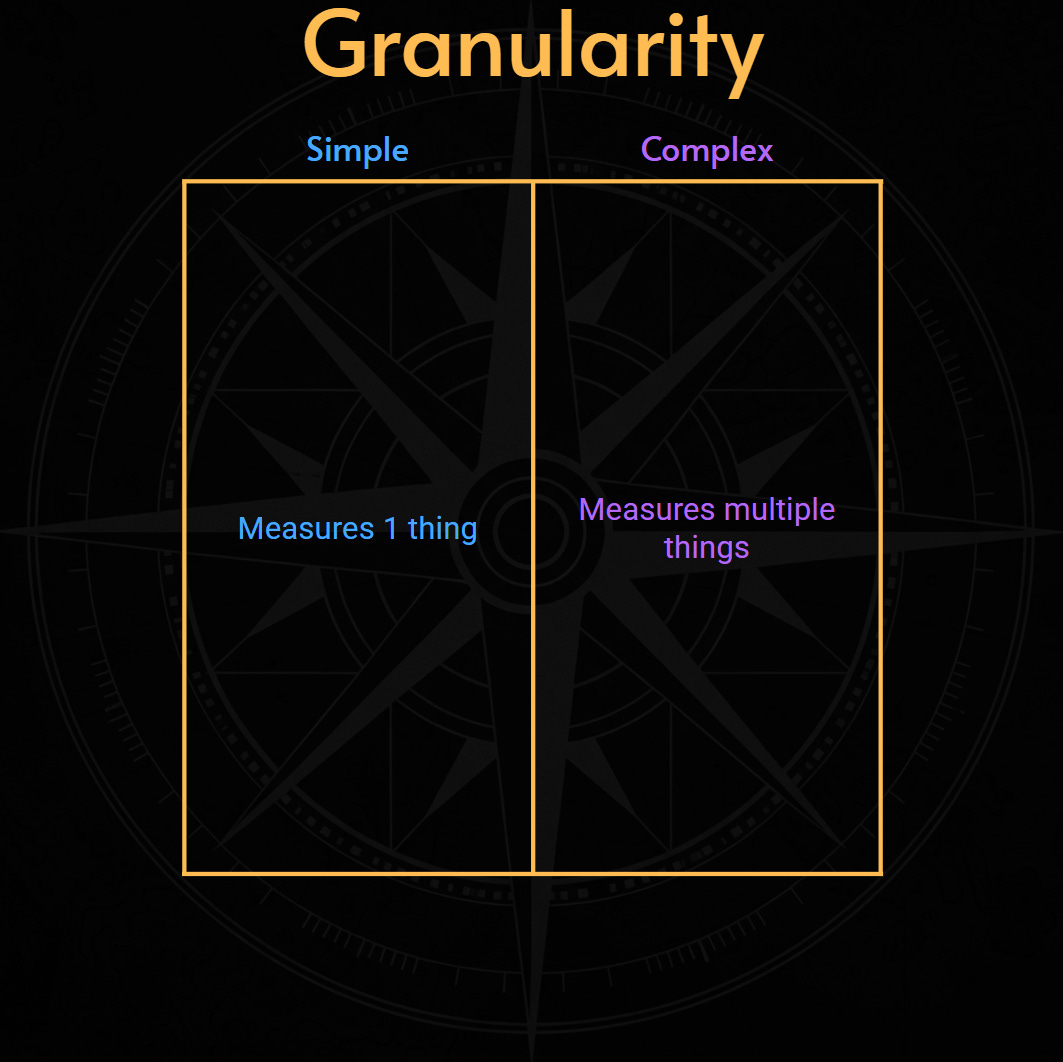
Granularity: how many variables and parameters are aggregated in a single data point?
We can combine these two dimensions to get a powerful but familiar quadrant model.

As we will see, a single category of SLIs like availability or latency, can fit into any of those 4 quadrants.
The two dimensions
1. Fidelity: how closely does the SLI represent the consumer experience?
SLI Fidelity, refers to how the data, or telemetry, is generated and how accurately it represents the consumer’s experience of the service.
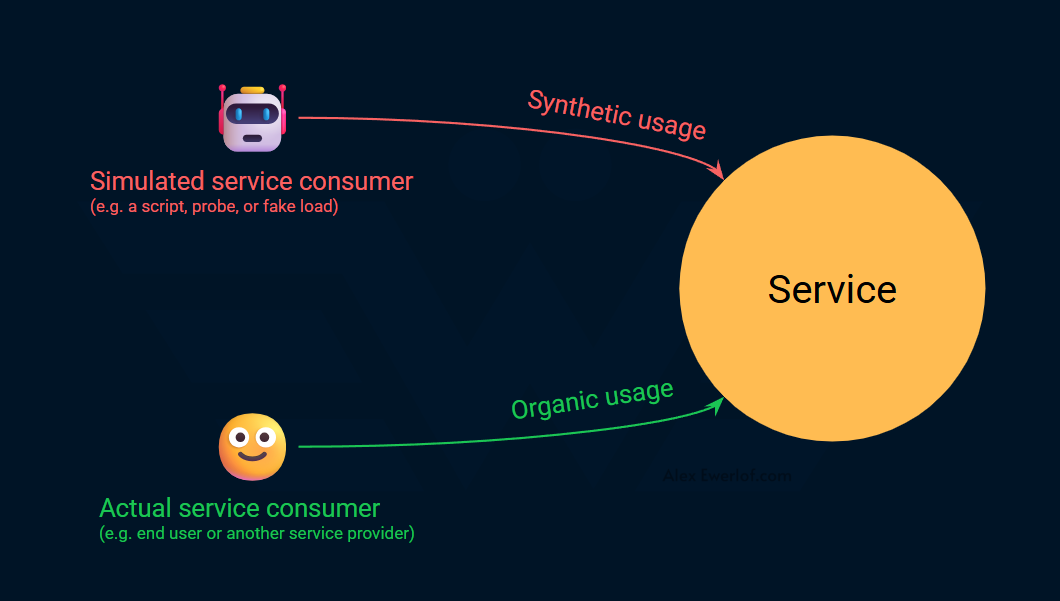
Synthetic metrics use artificial, fake, or simulated loads. A common example is a tool that pings an endpoint every minute to gather data about latency or availability. This check ensures the endpoint is responsive.
Organic metrics gather data from consumers actually using the service. For example, we can gather availability and latency data from API gateway that exposes a service externally. This is a more precise way to measure service level.
Organic metrics are more realistic. They map directly to what's happening in production.
However, they can be harder to measure. For high-traffic services, they can generate massive amounts of data. This requires a more robust and costly monitoring infrastructure.
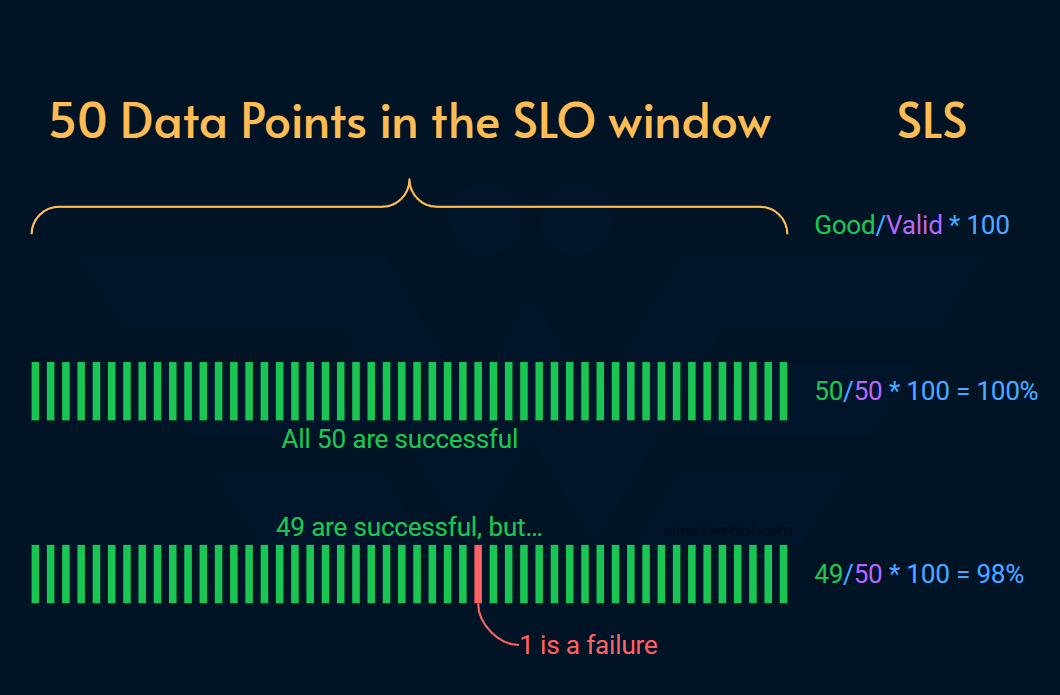
For low-traffic services, there may not be enough organic load to for the SLI formula to work correctly. That’s because SLI status (also known as SLS), is a percentage based.
For example, if a service receives 50 request per months, it is not reasonable to expect a success rate of 99% because a single failure in that period reduces the service level status (SLS) to 98%. In this case, one solution can be to use synthetic metric.
Synthetic load can potentially skew product metrics. For example, if the product is measuring MAU (monthly active users), it’s important to have a way to distinguish fake users (synthetic) from the real ones. Otherwise, wrong data can lead to wrong decisions.
2. Granularity: How many variables are aggregated by the SLI data points?
Let's look at the second dimension of SLIs: their granularity, which refers to the number of parameters or variables being tested to quantify the level of the service.
Simple: measure only one thing. For example, a simple metric might check if an endpoint returns a
200HTTP status code (for availability) or if a single API call's latency is below a threshold. This tells you the basic health of one component. It acts as a basic proxy for overall service health. It doesn't say if the service is actually useful to the consumer's complete task.Complex: measure multipel things. This tells a richer story about the consumer journey or complex system behavior. A high-fidelity metric could track the success rate and latency of all steps in a critical user purchase flow. It ensures they are working as expected.
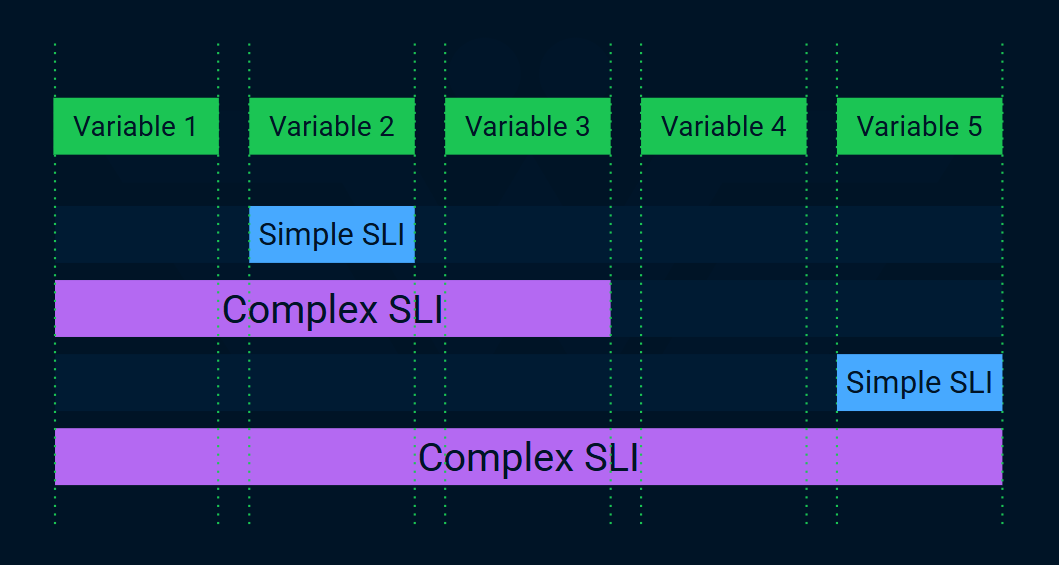
Complex SLIs aggregate multiple variables. For example, instead of pinging the home page (simple), we run a Playwright script that traverses a user journey to identify any broken step.
Complex SLIs can be more costly to maintain.
They might also introduce a lag in flagging an incident because they have to wait to get data for all variables. This is because they require more data processing and aggregation.
However, complex SLIs provide a higher-quality signal because they reflect a user's experience more accurately.
On the flipside, it can be harder to reason about the complex SLIs due to aggregation: if there’s a failure, what did exactly fail?
To answer that question, we need to store more data, which adds to the cost of complex SLIs.
One caveat for complex SLIs is the ownership of different variables. Most metrics aggregate multiple variables.
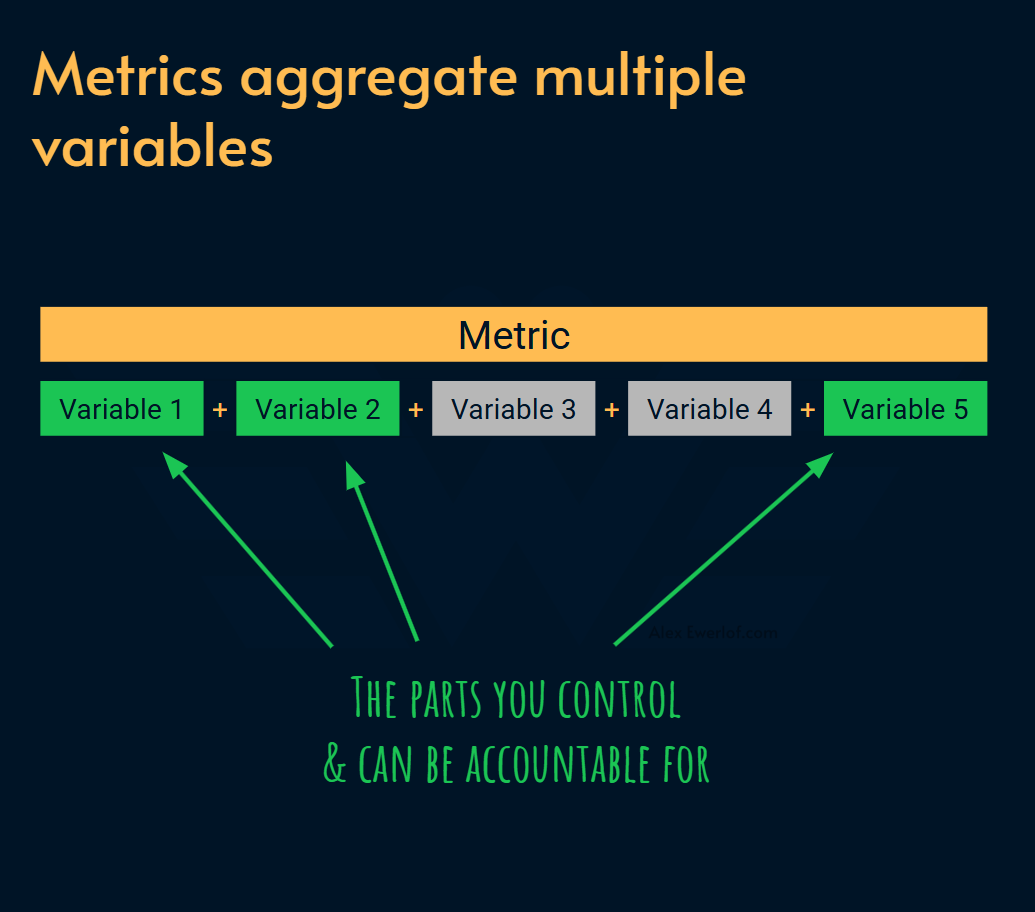
Ideally you want each data point to only aggregate variables that are within the control of one team. Because when the metric shows a service degradation or disruption, it is easy to reason about who owns the service and should receive an alert to fix it.
Putting it together
Putting everything together, we get this 2D Compass:
Examples
Availability is the most common SLIs. At the basic level it’s an answer to this question:
Is the service exposed to the consumer?
However, a better question can be:
Can the consumer use the service to do their tasks and achieve their goals?
The difference is subtle but important:
The former is aligned with the service provider’s basic commitment and is usually easier to measure.
The latter is aligned with the service consumer’s expectation and is typically harder to measure.

How can we measure availability for an API server?
Simple & Synthetic: ping the health endpoint every minute and calculate the percentage of successful pings in a period
Simple & Organic: count the number of minutes where the API endpoint could handle valid requests (i.e. with valid auth header) in a period
Complex & Synthetic: use synthetic monitoring to test that the critical user flow (e.g. a purchase journey) works and calculate the successful execution percentage
Complex & Organic: use the RUM (real-user monitoring) data to identify any broken user journeys and calculate successful user sessions
Let’s do this exercise for latency, which is the second most common SLI:
Simple & Synthetic: Measure the response time of a periodic
GETrequest to a predesignated endpoint (i.e.www.example.com/api/health) and calculate the P99 percentile over a period.Simple & Organic: Calculate the P99 percentile latency for all successful API requests from real users as measured at the API gateway.
Complex & Synthetic: periodically simulate a complete user transaction (e.g., login, search, add to cart, checkout) and measure the end-to-end response time.
Complex & Organic: Analyze Real User Monitoring (RUM) data to track the full-page load time, including all resource fetches and rendering, for critical user journeys.
Signal to noise ratio
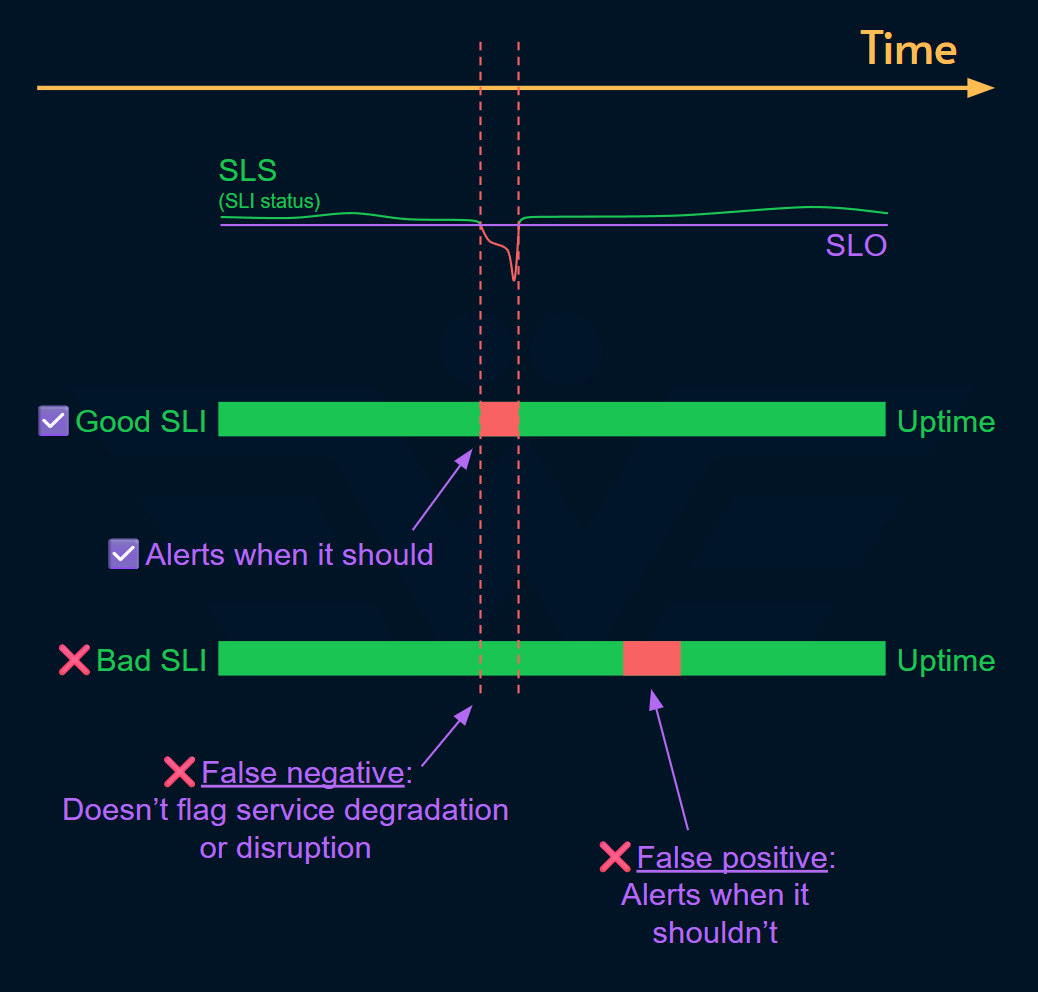
Good SLIs are worthy of being on-call for because they indicate service degradation or disruption with high accuracy. Even if there is no 24/7 on-call rotation, this is still a good mindset to evaluate an SLI:
Does this SLI help us get notified when there is an incident?
(incident in this context is any failure that threatens the business objective)Does each anomaly in this SLI indicate an incident?
(no false positive or false negative)
SLI is the basis for a solid ownership implementation:
SLI measures the level of service from consumer’s perspective
SLO helps:
The stakeholders set expectations on the service owner
The service owner communicate their commitment to service consumers
Alerts: tie that expectation or commitment to responsibility and accountability
Poor SLIs lead to broken ownership.

Pro Tips: When and how to use the SLI compass?
Broadly speaking there are 3 categories of use cases for SLI compass:
Evaluation: Assess the signal quality of an SLI and its effectiveness in implementing full ownership through alerts.
Investment: Estimate the ROI (return on investment) of an existing or new SLI
Evolution: motivate improving how tech health is measured using SLI and optimized towards an SLO
For example, when Service Levels (as a concept) is new to an organization, you want to start small and easy. A simple synthetic check like pinging the home page every minute is a pretty good start.
In fact, this is so common that there’s a whole product sector doing exactly that: Pingdom, UptimeRobot, etc.
But pinging the home page has its limits. As you gain experience with that metric, you may decide to measure more high fidelity and organic metrics.
Evaluation & Investment
As a general rule of thumb: the closer to the top-left, the easier and cheaper it is to measure the SLI but the lower the quality it has.
The more you move to the bottom-right corner of the compass, the harder it is to measure and more costly it gets but the quality improves.
Evolution
Over time, you may want to carefully move your measurement from the top-left to the bottom-right corner considering the ROI.
You may go from simple synthetic to complex synthetic or simple organic. Eventually you may end up with complex organic SLIs.
Alternatively, maybe you’re in 4 but the SLI is too expensive for what it’s doing. Therefore you may deliberately go for a cheaper measurement with lower or equal quality.
Final Thoughts
The quality of your SLI depends on the story it tells. It must reflect the consumer's experience. This is crucial. An SRE's error budget must always be tied to a metric that accurately reflects user’s tolerance for failure.
The SLI Compass provides a clear path for evaluation, investment and evolution. You can use it to design and refine your SLIs. SLIs are not a one-size-fits-all metric. Make a conscious choice with signal to noise ratio and ROI in mind to reduce alerting false positives or false negatives.
My monetization strategy is to give away most content for free but hese posts take anywhere from a few hours to a few days to draft, edit, research, illustrate, and publish. I pull these hours from my private time, vacation days and weekends. The simplest way to support this work is to like, subscribe and share it. If you really want to support me lifting our community, you can consider a paid subscription. If you want to save, you can get 20% off via this link. As a token of appreciation, subscribers get full access to the Pro-Tips sections and my online book Reliability Engineering Mindset. Your contribution also funds my open-source products like Service Level Calculator. You can also invite your friends to gain free access.
And to those of you who support me already, thank you for sponsoring this content for the others. 🙌 If you have questions or feedback, or you want me to dig deeper into something, please let me know in the comments.
This framing makes the real problem visible. Most SLIs fail because they are cheap stand-ins for the user experience. The fidelity and granularity compass makes the tradeoff explicit and shows how signals can stay coherent while drifting away from what users actually feel.
Hi, Alex. It seems like a high fidelity SLI is essentially an QA integration test. Is that accurate to say?