SLO: Elastic vs Datadog vs Grafana
Reviewing the Service Level implementation in 3 observability providers
I’ve spent the past few years learning, teaching, and coding service levels. So I got curious to see how the well-known observability providers implement it.
This post is my independent review of all 3 with snapshots.
Disclaimers
This is not a paid or affiliated review. None of the vendors got the chance to see my review before it went public and I’ll clearly mention if they ask me to do an update.
This review was carried at early September 2024 on the same day for all 3. Obviously, the UI and feature set may change in the future.
If I missed or misunderstood something, you can correct me in the comments.
I don’t represent my current or past employers or customers on my personal blog. This review is my independent investigation.
Elastic
The first stop is Elastic because they were open source, then they were not, and recently they are open source again!
Unfortunately, the SLO feature is only available in their Platinum price tier at the time of this writing. I really hope this will change because if metrics are data, Service Level is the perspective that makes that data actionable in relation to business objectives and consumer needs.
Charging for SLOs separately is like charging a premium for GPS navigation system of a car. Do vendors do that? Yes. But they also force the majority to use their phone instead. SLO is not rocket science, don’t force people to use alternative solutions just to take full advantage of the data they’re already sending your way! If anything, having SLO on all plans is a motivator to send more data because of the value it creates.
So I’m gonna go MKBHD on this one:
Once you do have access, SLOs have a prominent place in Elastic UI which is great!
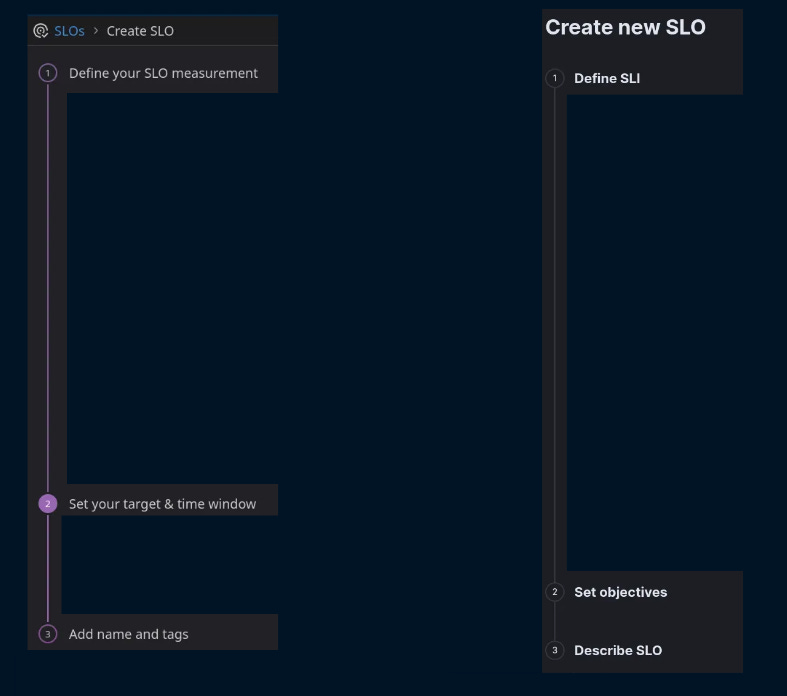
Elastic uses a 3-step single page setup for creating new SLOs:
Right off the bat, you have to choose a SLI type:
As discussed before, there are only 2 types of SLI:
Event-based: count the percentage of good events in a period
Time-based: count the percentage of good timeslots in a period
Later the UI Elastic has the “Budgeting Method” which tells me that the Elastic team is aware of the two SLI types:
The “SLI type” drop down seems unnecessarily complicated but as we’ll see shortly, Datadog is doing something similar. I’d drop the word “type” or use “templates” instead because where’s in the menu (latency, availability, etc.) are common SLI examples.
Let’s pick one and roll with it.
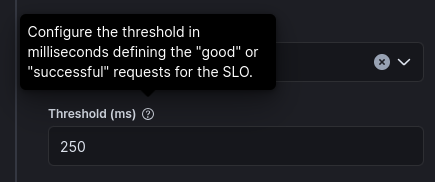
It’s nice to see a live preview of the SLI. The Threshold field only allows setting the upper threshold:
Aside from being upper-bound, the definition of Good may be lower-bound or even bound between two thresholds. Those options aren’t available.
Note: it is possible to convert any definition of good to look upper-bound. But that creates complexity that you’d expect your observability platform to handle out of the box.
There are 2 types of compliance period (Time Window):
Rolling: e.g. always check the last 30 days
Calendar-bound: e.g. check the budget in the current month
In Elastic, your choice of Duration for rolling window, however, is limited to 7, 30, and 90 (just like Datadog).
Grafana is the only one that allows any number and as we’ll discuss the most important missing option is 28 days.
Elastic is the only one in this review that supports Calendar-Bound SLO windows out of the box.
Unfortunately, you have even fewer options: weekly and monthly.
Weekly is particularly tricky because different countries across the world start the week on different days:
Elastic does not allow invalid SLO targets like 0% or 100%. They do however allow ridiculously low numbers like 0.1 while blocking 0.0001:
Similar issue exists for the upper end of the spectrum where a SLO of 6-nines is forbidden:
Admittedly, 6-nines is not very common (and has a high cost) but I don’t see a reason why the tool should get in your way if that’s your SLO.
However, if their SLO implementation is limited to 3 fractional positions, that is a serious issue. Essentially you won’t be able to implement SLOs like 99.1234% because it’ll be truncated to 99.123%. I haven’t tested that. If you know more, please comment down below.
After you create a SLO, the waiting spinner starts rotating for a long time. In my test, I waited about 30 seconds before the SLO was created which is by far the longest in this review.
When it succeeds, your brand new SLO gets a default dashboard.
The bottom part of the page is interesting where you can see the good and bad events in a stacked bar chart:
You can also see the Burn Rate and Historical SLI (which I call SLS for Service Level Status).
Elastic does not create alerts by default despite me setting a target for the SLO. This is a flaw they share with Datadog.
Without Alerting, there is no commitment towards the SLO. SLOs are important enough to nudge the user to create alerts in the initial SLO configuration screen.
Fortunately, creating an alert is just a click away (as mentioned in their SLO creation documentation):
The alerting setup for burn rate looks intimidating and complete:
It’s a nice touch that Elastic prefills the multi-burn rate alerts with decent default values.
But once you look closer, you realize that the config for short lookback alert window is missing. This feature is important for reducing false alerts as pointed out in Google’s SRE book.
Elastic SLO Alerting documentation states:
Your short lookback period is set automatically.
Google recommends 1/12th of the long window and I’m guessing that’s what they’re going for. Hard to tell. The docs are 🤐 on that.
I also really like that Elastic allows switching between Burn Rate and burn percentage with the flip of a button:
However, for the life of me I cannot understand it. As you can see in SLC, you need to set both the burn rate and error budget consumption percentage. Elastic seems to automatically set that value (as seen in the grey text).
Like regular alerts, Elastic offers a wide range of notifications and actions when the SLO alert goes off.
Datadog
Datadog’s Service Level feature is under Service Mgmt menu (which if you’re wondering, stands for “Service Management” in a world where the UX team wins the battle over UI designers): 😁
Before digging into UI, I just want to call out their excellent documentation on the topic completed with an ebook.
Just like Elastic, Datadog uses a single 3-step screen for setting the SLO:
If I recall correctly, Datadog had the SLO feature way ahead of the pack whereas Elastic recently introduced it. So it’s up to you to guess who has copied whom. I mean, one of them could pick a different style for the 3 step numbering?
SLI can either be time-based or event-based. Datadog offers two time-based SLIs:
By monitor uptime: requires having set up a monitor (an Alerting Rule)
By time slices
When it comes to evaluating the monitor (Datadog lingo for Alerting rules), it has the same limited choices as Elastic: 7, 30, and 90.
I do like the live preview of the monitor uptime however (Elastic has this feature too):
For event-based SLIs (or “By Count” as Datadog calls it), you can choose two metrics for Good/Total Events:
This is a heterogeneous SLI (when the two metrics aren’t tightly coupled). Heterogeneous SLIs are easier to implement in an already existing observability platform—”just give me 2 metrics”.
But in practice, they can be hard to reason about as clearly demonstrated with this funny error message:
Personally, I prefer the homogeneous SLIs where there is one metric that can be processed to identify good events.
Even though you can pick Good/Total, the live preview shows Good/Bad:
Datadog doesn’t allow invalid SLOs like 0% or 100%:
For the time-based SLIs, I appreciate the simplicity and control in Datadog’s UI for choosing the boundaries of good:
There is more control and settings that I can understand, yet the UI is simple enough that I think I can understand if I need to!
I also like their Warning Threshold which fits nicely with how Alerting/Monitoring is done in the rest of the Datadog platform.
Although it can lead to alert fatigue. Done right you wouldn't need warnings because of how Google cleverly uses long window and short window. Fortunately warnings is an opt-in feature in Datadog.
Once you create the SLO, you’re presented with a very well thought through dashboard showing Error Budget Burndown, Burn Rate and the color coded status:
Overall, Datadog continues to impress me with their UI but their price tag remains a pain point for many teams.
One important issue to note is that Datadog does not create monitors by default despite me setting a target for the SLO:
Just like Elastic, Datadog doesn’t create alerts out of the box. Fortunately, creating an alert is just a click away:
But it would be better to get the alert as part of setting up the SLO.
When it comes to setting an alert, you have two choices:
By Error Budget consumption
By Burn Rate
For the Error Budget burn, I find the default choice of 100% very curious! Here Datadog does not make any effort to make it easier to set a sane default (what happened to POLA?).
I would have gone with any of the defaults suggested by Google which is max 10%!
For the Burn Rate, you need to know what you’re doing. Here, I have configured it according to one of Google’s recommendations:
The short window lookback is also hard coded to 1/12th of the long window. This is a sane default and still better than Elastic that hides this information. But I miss the ability to set it to other values. Whoever wrote the documentation was aware of at least 1 use case for it
If you find that your burn rate alert is consistently too flaky, this is an indication that you should make your short window slightly larger.
Nor can I disable short window alerts.
In the Service Level Calculator, you can see all 3 suggestions:
Note that the 1h/5m recommendation is for a 30 day SLO window.
For a 7-day window, if you go with 2% consumption at 14.4x, you’ll end up with 14 minutes for long window lookback and ~1 minute for short window lookback. Technicalities, I know, but it feels that Datadog’s SLO feature is just put together in a sloppy manner to tick a feature box. I have higher expectation at Datadog’s price point especially because the rest of their platform has a great UX.
Again, what they miss in their UI, they cover with documentation:
The documentation has terms like “good behavior” instead of “good events” or “good timeslices”.
I also found the term “theoretical error budget” confusing, but the document does not disappoint with wise sentences like this:
theoretical error budget consumption and actual error budget consumption are equal because time always moves at a constant rate
You don’t say! 😂
Fine! What’s wrong with just plain “error budget”? You certainly don’t find a reference to “theoretical error budget” in Google’s books. Service Levels are already hard enough. Why make the learning curve even steeper by making up new words? (Uhm, said the guy who invented SLS and 10x/9!) 🫠
To my knowledge Datadog doesn’t support OpenSLO but they support Terraform.
Grafana
Grafana refers to Service Levels as SLO and carefully hides them under Alerts & IRM. IRM stands for Incident Response Management, if you’re wondering about that obvious acronym! Dammit UI designers! 😂
This is already a nice touch because Service Levels need to be tied to some responsibility and alerting is the absolute basic mechanism to do that.
In fact, alerting is such a prominent feature of Grafana Service Level implementation that it has a dedicated filter in the SLO management:
Alerts are also a key attribute of the SLO. A dedicated button takes you directly to alerting configuration:
Love it! 💖
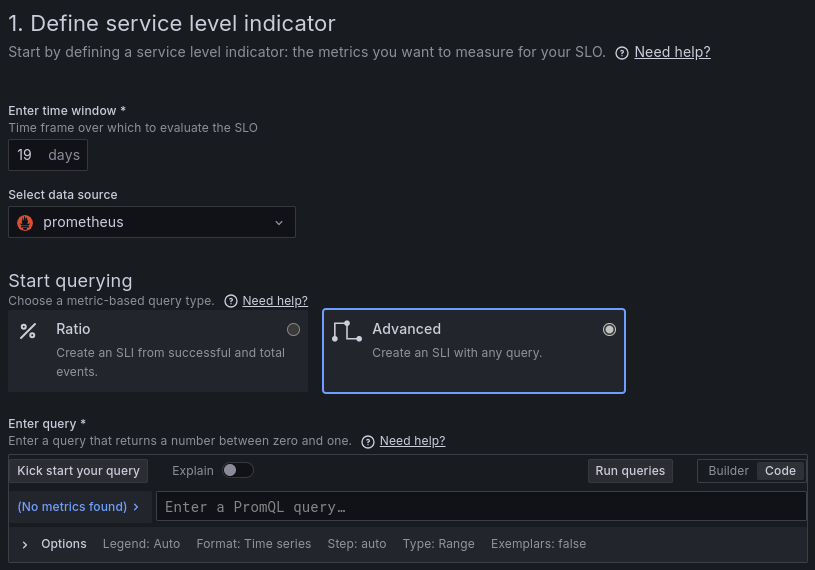
The process of creating an SLO is straightforward using a wizard UI:
You see? 5 steps! Not 3! And certainly no circles. Grafana is original! Or at least their UI designers know how to work from home.
You can enter any compliance periods as long as it’s in days… Or nights… You get the idea! 28 days is common for weekly seasonality (when the metric trend follows a weekly pattern) but 30 days is the most common:
Grafana doesn’t seem to support calendar-bound compliance periods (e.g. budgeting per calendar month) as far as I can tell..
SLI can be either time-based (e.g. uptime) or event-based. Grafana’s default UI doesn’t bring up that aspect which is a miss. Typically, time-based SLIs are easier to start with and I’d expect to see that choice in the first step of the wizard as a prominent option.
As we discussed before, the formula for SLI is success divided by valid events or timeslots.
There’s a distinction between valid and total which is often underutilized. Grafana chose the simpler term:
Just like the other two, Grafana only supports heterogeneous SLIs.
I suppose homogeneous SLIs are possible in the Advanced view, but my evaluation instance didn’t have enough data to try this aspect:
Setting SLO and Error Budget in one step is another nice touch in Grafana because these two values are tightly coupled:
However, I would have preferred a percentage slider as implemented in SLC because unlike other settings, this one can only be between 0-100 (typically above 90%).
This is absolutely not a deal-breaker, but what is a deal-breaker is the fact that you can set the SLO to 100% and it doesn’t even complain! 😱
However, setting it to 110% seems to kick in the validation mechanism:
Although they still show an error budget of -10%? Is that a budget or giveaway? 🤑
Personally, I’d prefer the UI to scream if the value is too close to 100%. For example, SLC shows an error with a link to the rule of 10x/9:
Picking an unrealistic value like 100% can negatively impact the alerting experience or deployment frequency (100% is totally fine for SLS but not SLO).
That’s one reason that SLC exists: to set reasonable expectations.
Moving on. Another aspect of Grafana’s Service Level implementation that I absolutely love is their categorization mechanism:
You can put the SLO in a folder
It to a team name
And define custom labels for it (both Datadog and Elastic have this feature)
These features make it easier to manage SLOs across a large organization, which is exactly the type of challenge I am dealing with. Kudos for that.
The 4th step of defining a SLO in Grafana is Alerting.
There are two predefined alerting rules to pick from:
Fast-burn alert has 2 rules:
Burn Rate: 14.4x
Long lookback window: 1 hour
Short lookback window: 5 minutes
Burn Rate: 6x
Long lookback window: 6 hours
Short lookback window: 30 minutes
Slow-burn alert also has 2 rules:
Burn Rate: 3x
Long lookback window: 1 day
Short lookback window: 2 hours
Burn Rate: 1x
Long lookback window: 3 days
Short lookback window: 6 hours
Apart from the 3x rule, the rest comply with Google’s recommendation:
Notice that Grafana does not provide a setting for adjusting the percentage of error budget that is allowed to be consumed before triggering the alert. That’s because their settings are primarily focused on the lookback window and burn rate.
I would prefer working with the percentages because they’re easier to reason about than a time period.
Which one would you pick:
Trigger an alert after burning 2% of error budget at +14.4x
Trigger an alert after burning the error budget at +14.4x over the last 1h and still burning in the last 5 minutes
The time-based settings are more sensible for the time-based SLIs —which as we discussed aren’t explicitly supported by Grafana. This is just confusing to me.
Another confusing option is the Minimum Failure Threshold:
It is an Advanced Option allowing you to set the minimum number of failures required for the alert to fire. But I don’t understand why it’s necessary (I’m guessing it was added as an after-thought due to problems with the purely time-based alerting options namely when there’s not enough failures.
What is an alert without a notification? Unfortunately, the notification settings aren’t part of the wizard. All you get is this:
If you click that link, you’ll be thrown into the generic alerting menu. This makes it easier for Grafana implementation DRY-wise but breaks the nice flow of the wizard.
Fortunately, the SLO Alerts will use the default notification policy, which is a sensible choice.
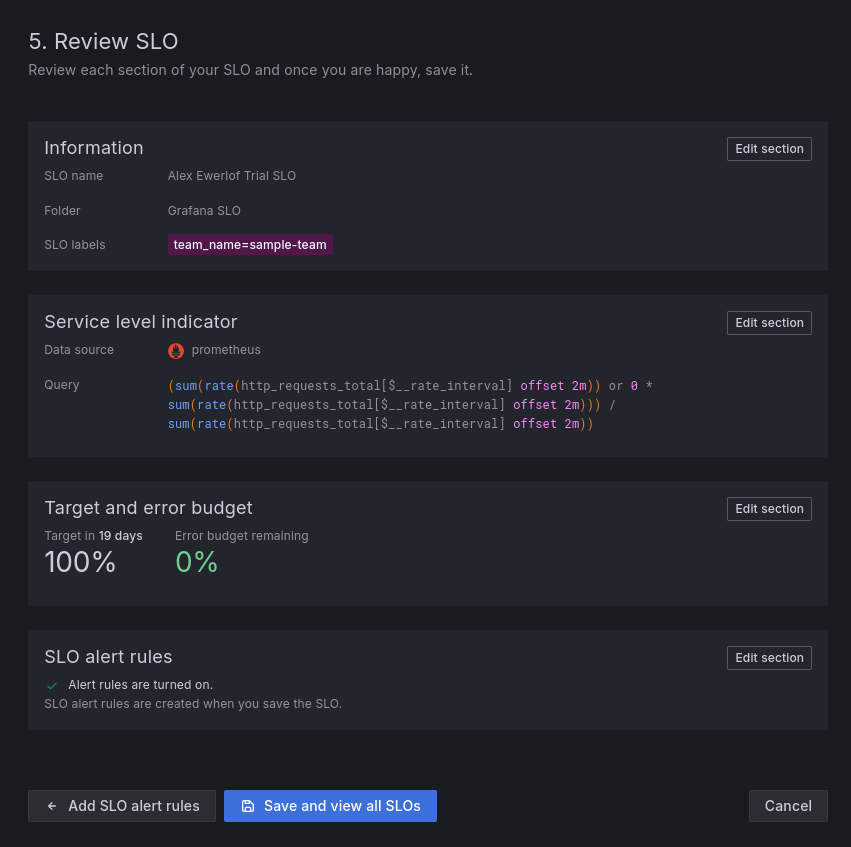
Step 5 is a review screen so it could totally be a 4-step process.
I did not see a live view of the SLO settings, something that had a prominent place in both Elastic and Datadog SLO setup screen.
Notice how Grafana happily accepted my unrealistic SLO of 100% while highlighting a 0% error budget in green:
Fortunately, this should be very easy to fix: if it didn’t allow me to type 100% in step 2, this wouldn’t happen.
Sum up
Datadog has the best UX followed closely by Grafana. The reason Datadog wins the UX is their excellent documentation which honestly is a great learning resource whether you use their platform or not.
Elastic’s UX looks similar to Datadog but more janky and less sensible copy. And short window is missing from the UI.
Grafana has the most complete options. It allows setting custom days for rolling windows but misses time-based SLIs.
Both Grafana and Datadog support setting SLOs on synthetic monitoring. I’m guessing Elastic does too but I didn’t try.
All 3 only support heterogenous SLIs.
Datadog has the most awesome out-of-the-box SLO dashboards again followed closely by Grafana.
Alerting is a very important aspect of SLOs. Admittedly it is hard to get right and I have it in my backlog to explain in a separate blog post.
Grafana has the best alerting setup for the mere fact that it is an integrated part of setting up the SLO. Both Datadog and Elastic require an extra step to set alerts.
Datadog and Elastic come second for different reasons:
Datadog doesn’t have good defaults
Elastic has nice defaults but misses key configuration options
Personally, I prefer Grafana when it comes to the SLO implementation.
These posts take anywhere from a few hours to a few days to ideate, draft, research, illustrate, edit, and publish. I pull these hours from my private time, vacation days and weekends.
Recently I went down in working hours and salary by 10% to be able to spend more time learning and sharing my experience with the public.
My monetization strategy is to give away most content for free because I believe information should be free and accessible. You can support this cause by sparing a few bucks for a paid subscription. As a token of appreciation, you get access to the Pro-Tips sections (on some articles) as well as my online book Reliability Engineering Mindset. Right now, you can get 20% off via this link. You can also invite your friends to gain free access or get a discounted group subscription. There’s also a referral bonus program to gain free subscriptions.
Thanks in advance for helping these words reach further and impact the software engineering community.










> Elastic does not create alerts by default despite me setting a target for the SLO. This is a flaw they share with Datadog.
We create a burn rate rule with the sane defaults in the background based on your SLO. When you submit the SLO you should see a little notification like "Burn rate rule created successfully". In the screenshot you posted, there was a button that said "Manage burn rate rule", that's only active when the rule already exists. The "Create burn rate rule" link is also there because we allow users to create more that one burn rate rule per SLO.
Since this is a new product for us, we are continually collecting feedback and applying it. Thank you for including us in the review, we are taking notes :)
Thank you for this great writeup. I work on the SLO product at Grafana and appreciate the feedback in here, we'll review and look to address in future releases.