

SLI Evolution Stages
How to dodge vanity metrics and measure the right service level indicator and why?

Over the past few years, I’ve gone through hundreds of architecture diagrams and system topologies to help teams answer a simple question:
How to measure the level of a service?
This question is extremely important because Service Level Indicator (SLI) serves two important purposes:
Give a focus to any optimization effort
Throughout this experience, I have observed a few distinct stages of implementing SLI. Each stage has a distinct concern and signal quality.
SLI Compass helps assess the value of a SLI and paint a road to evolve it. This article lists those stages to help guide senior engineers, technical leaders, and CTOs to guide the evolution of SLI measurement.
🤖🚫 Note: This content is organic. No generative AI was used to create this content. This page is only intended for human consumption and is NOT allowed to be used for machine training including but not limited to LLMs. (why?)
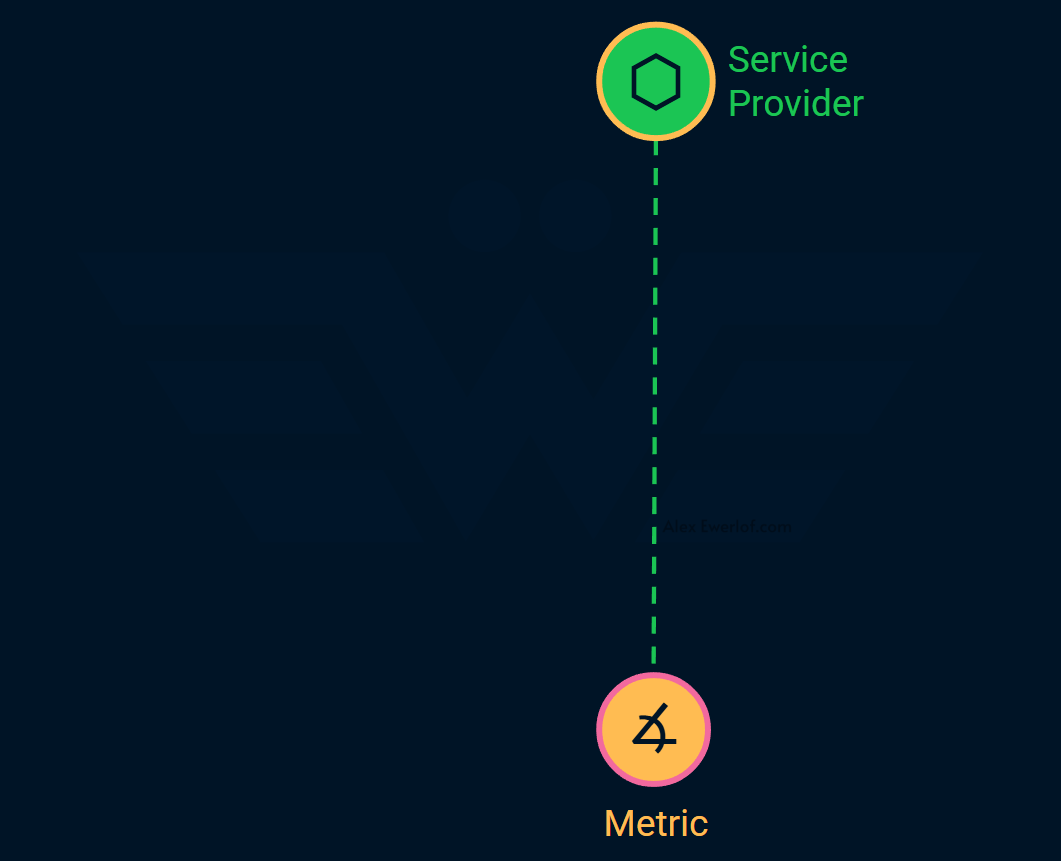
Stage 1: Traditional SLI
This is the most basic SLI, often inspired by reading some introductory literature on SRE or attending a conference or meetup.
The are only 2 elements at play:
Service provider: For example, a backend, a database, or a microservice. At this stage, often the difference between a service and a service provider is ignored. Reminder: service is a feature or capability that’s built towards a consumer, service provider is the entity that provides that service.
Metrics: usually availability, latency, error rate or some other generic metric.
This is not vastly different from traditional monitoring, but with fancier names and cargo culting big tech.
Stage 1 SLIs typically come from one of these sources:
Rebrand: some existing metric is normalized to a percentage value. For example, if you were charting API latency in relation to a threshold before, your SLI shows the percentage of responses below that threshold.
Cookie cutter: you just use one of the 4 “golden signals” (latency, traffic, error, saturation).
The iconic characteristic of stage 1 SLIs is the absence of research into consumers and/or the reason they use the service. There might be some guesses but no solid verification.
Why does it matter? Because SLI quantifies how reliability is perceived from the consumer’s perspective. If a metric indicates failure but the consumers don’t care, it’s not a good indicator for the level of the service.
Regardless, this is a good start. You may even get lucky and pick a good metric to measure, but it is not a deliberate implementation of SLI.
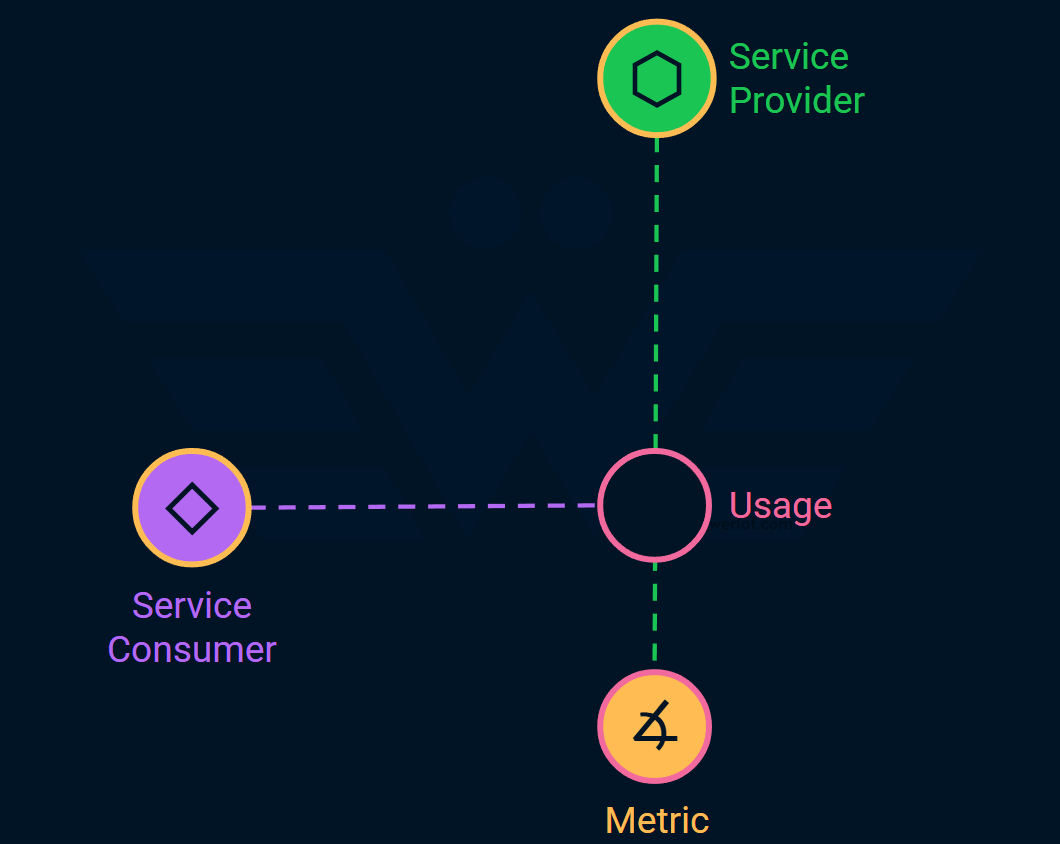
Stage 2: Consumer-aware SLI
This is when the consumer enters the scene. Maybe, you’ve been using a stage 1 SLI for a while and nobody cares, so you realize that you have to talk to the consumers? Or maybe, your consumers are asking for a specific SLI. Maybe, it’s part of an SLA even!
Regardless, there are 2 more elements at play:
Consumer: the entity which interacts with service provider in some shape or form. For example, the end user who uses a mobile app. Or an internal or external product that uses your API.
Usage: this just connects a consumer to a provider.
It may not look like it, but this is a huge step forward. Most teams I meet don’t even know who consumes their service, or their consumer is someone other than who they think it is!
Identifying who consumes your service is the first step to becoming service-minded engineers.
Opening a conversation between engineers and their consumers is a moment of epiphany for many engineers who are stuck between a ticketing system and keyboard.
To pick the best metrics, you need to talk to your service consumers and ideally observe how they consume your services. Consumers use your service because they have a goal in mind and tasks to fullfill those goals.
Stage 3: Task-aware SLI
When a service is working as expected, it’s not even noticed! It is when the service fails that reliability becomes a priority!
To methodically get to the right SLIs, it is not enough to identify the consumers. We need to identify their:
Goals: why do they use your services? What are the problems they’re trying to solve? This is important because products are solutions to someone’s problem.
Tasks: how do they use your services as a solution to their problems. This is where things get interesting because a failed task indicates unreliability.
In my experience, the SLI formula has a misconception built-in: it is optimistic:
What we’re really after is the Service Failure Indicator:
Let’s not sidetrack the conversation by introducing a new acronym. As long as you’re aware that our goal is to measure failures, we are good.
We have 3 more things to consider:
Service: the feature, capability, or solution that the service provider offers, often with a business value in mind. For example, a login screen, a database API, or an IoT hive.
Task: the activities that the consumers do to achieve their goals. For example, they may use the login screen to authenticate.
Failure: how does the service fail the consumer when trying to do their tasks or achieve their goals?
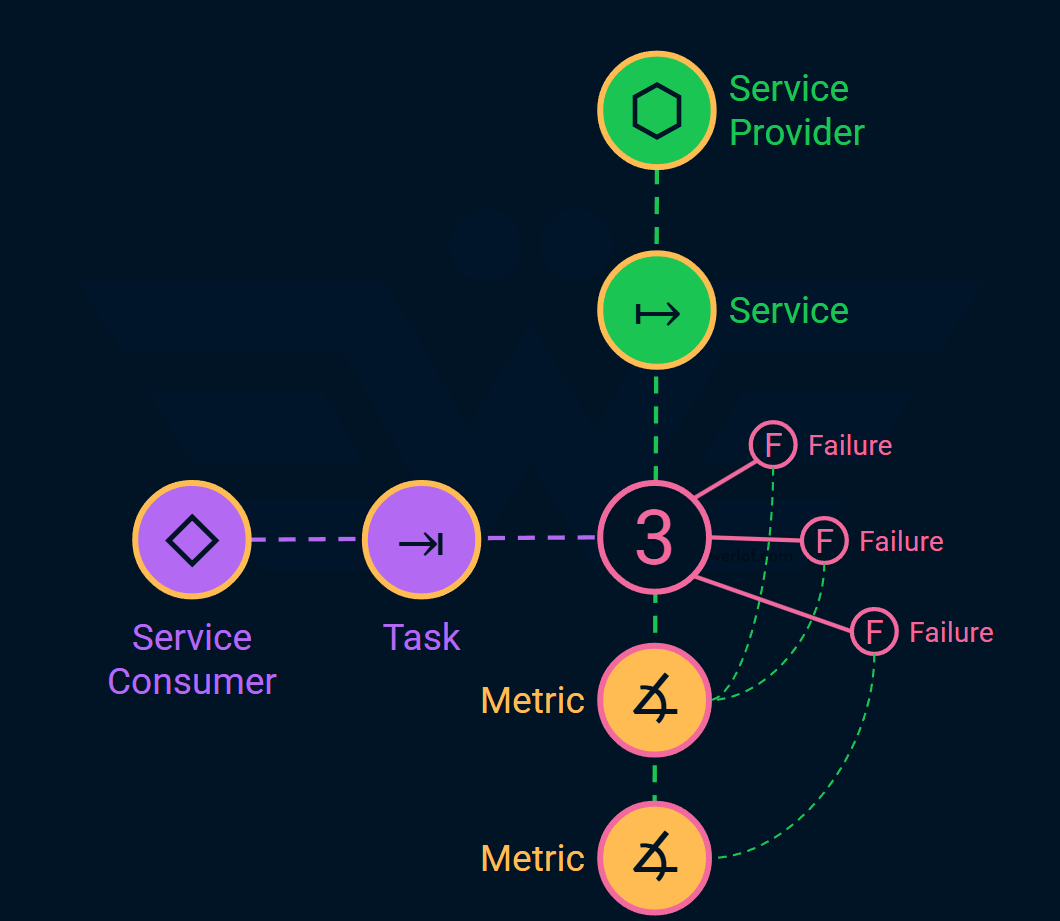
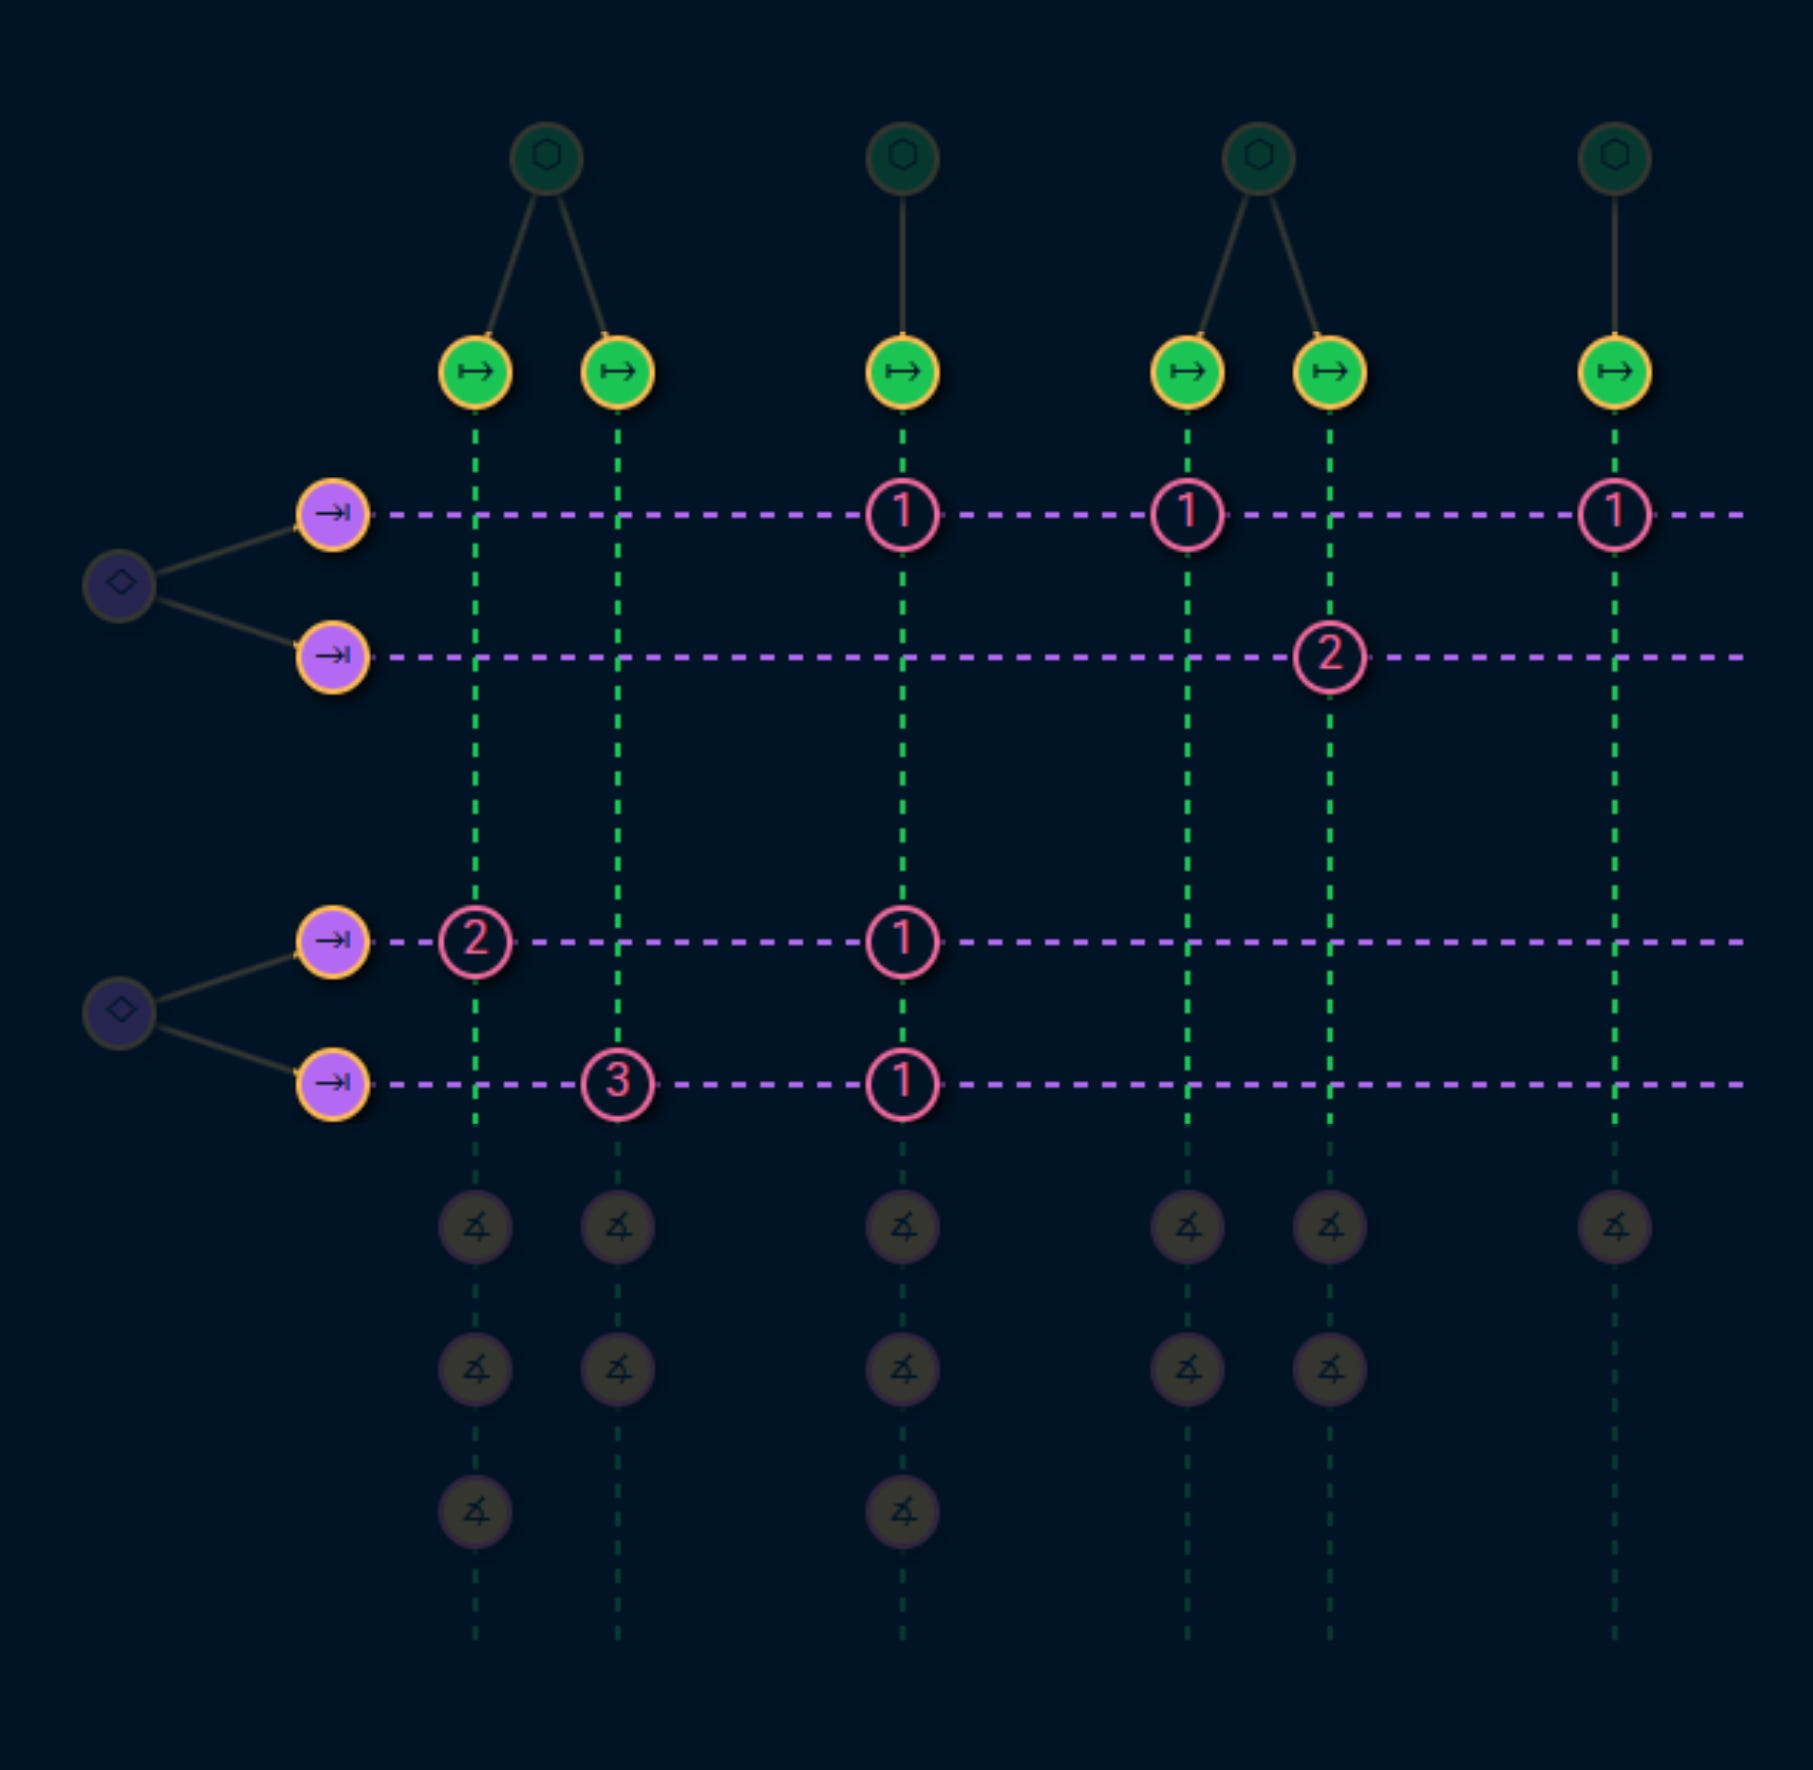
The usage connects the service to the task and that’s where the failures happen. Here, we have put the number of the identified failures on the usage.
For example, if the end users (consumers), use the login page (service) to identify themselves. Failures from their perspective may be:
The log in screen refusing to let them in despite using valid credentials
Having no access to their data after logging in
Being constantly thrown out of the system for no apparent reason
That’s the service level degradation we want to measure as a SLI.
Note that consumer doesn’t have to be an end user. A GraphQL relay that uses an upstream backend may fail if the query takes too long to respond. Similarly, a front-end that uses a dedicated BFF (Backend For Frontend), may fail if the API schema doesn’t match the expectation.
Identifying what may fail is a big part of the Service Level Assessment. You may end up discovering tens or even hundreds of failures. It can get overwhelming to set an SLI for every possible failure. That is when the business impact comes into the picture.
Stage 4: Business-aware SLI
The most mature SLI in this model prioritizes failures based on their business impact. That is because not all failures are created equal. Therefore, our response to a failure should reflect its impact on the bottom line.
In the previous stage, we oversimplified the failure a bit. If we dissect the failure, we can see the following 3 parts:
Symptom: how the consumer knows that something is wrong. For example, the site is slow, or doesn’t load.
Consequences: how the failure impacts the consumer’s task. For example, the site is so slow that they cannot proceed to checkout, or maybe a valid discount is not applied making them abandon the shopping card.
Business Impact: how the consequences is bad for business. We can quantify the business impact in order to focus our attention on the most important failures.
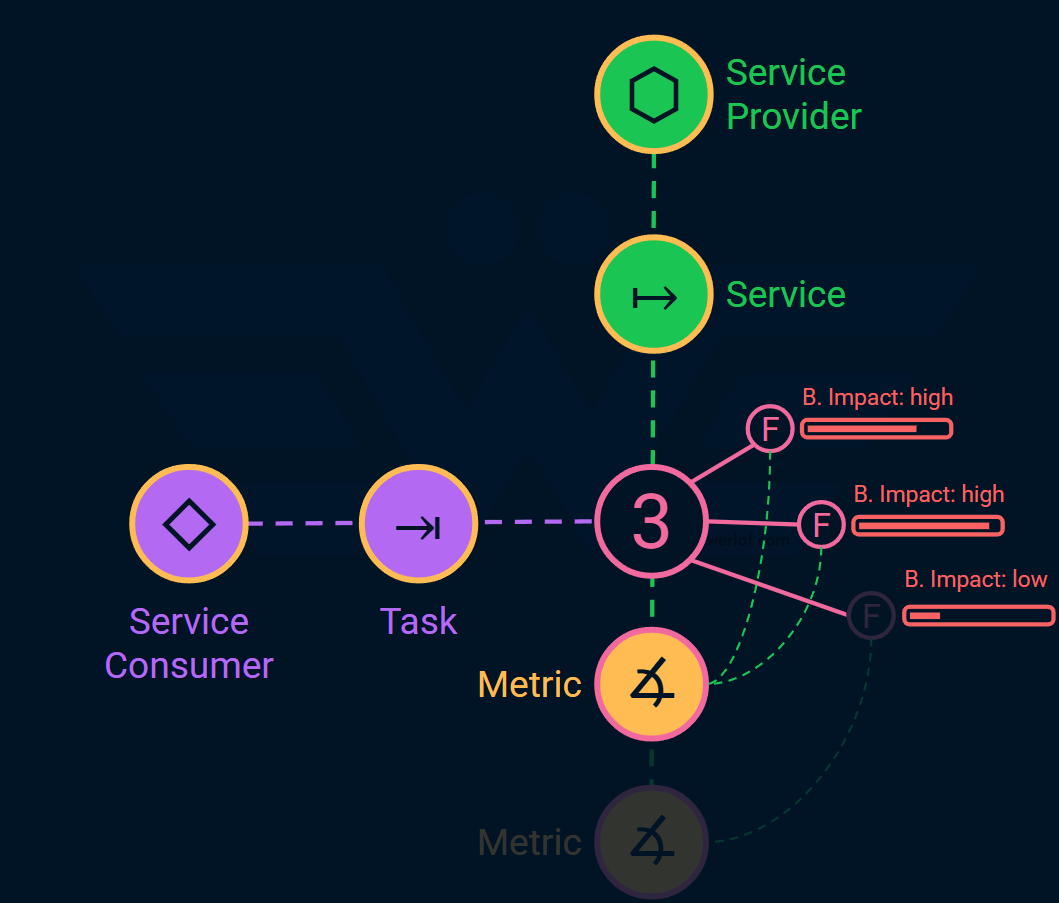
Each metric measures 1 or more failures. For example, the API latency metric can give us a heads up about some failures, while data inconsistency gives us a heads up about other failures. The two may overlap and corelate but by identifying Consumers, their Tasks, and Failures, we try to systematically identify metrics that matter the most business-wise.
How to quantify the business impact?
The formula for bottom line is:
Anything that increases expenses, or hurts the revenue, has a business impact. The more the impact, the worse the failure and the more important it is to measure it.
Just like your own business value, it is not always straightforward to estimate the value of a service.

Fortunately, we don’t have to be scientific here. As long as the failures are sorted, we can prioritize the most impactful SLIs. This ordering helps eliminate some of the less impactful SLIs.
Some examples of business impact that I’ve seen in the wild in ascending order of impact:
Making a bad impression: the site has occasional hiccups in a specific location causing user frustration
Customer support cost: a device firmware fails to load causing the users to contact customer support which costs the company to close the ticket
Breaching trust: showing ridiculously high prices for items on the website due to a bug in currency conversion causing the users not to trust the site to place an order.
Losing potential customer: the site is down, so the user may go to your competitor
Losing money: selling the product significantly cheaper than the actual price due to a bug! In many parts of the world, the deal is binding and the buyer may not be willing to pay the difference, even if the merchant spends the time and money to individually contact each lucky user
Losing legal fees: logging PII (personally identifiable information) AND user credentials in cleartext AND failing to inform the users withing 72 hours resulting the business to lose €20 million or 4% of global annual turnover whichever is higher.
All of the above: Volkswagen scandal! 😄💸
Incident Severity?
You may notice that the business impact sounds very similar to incident severity levels. There’s a good reason for that: they both try to quantify the business impact of failures.
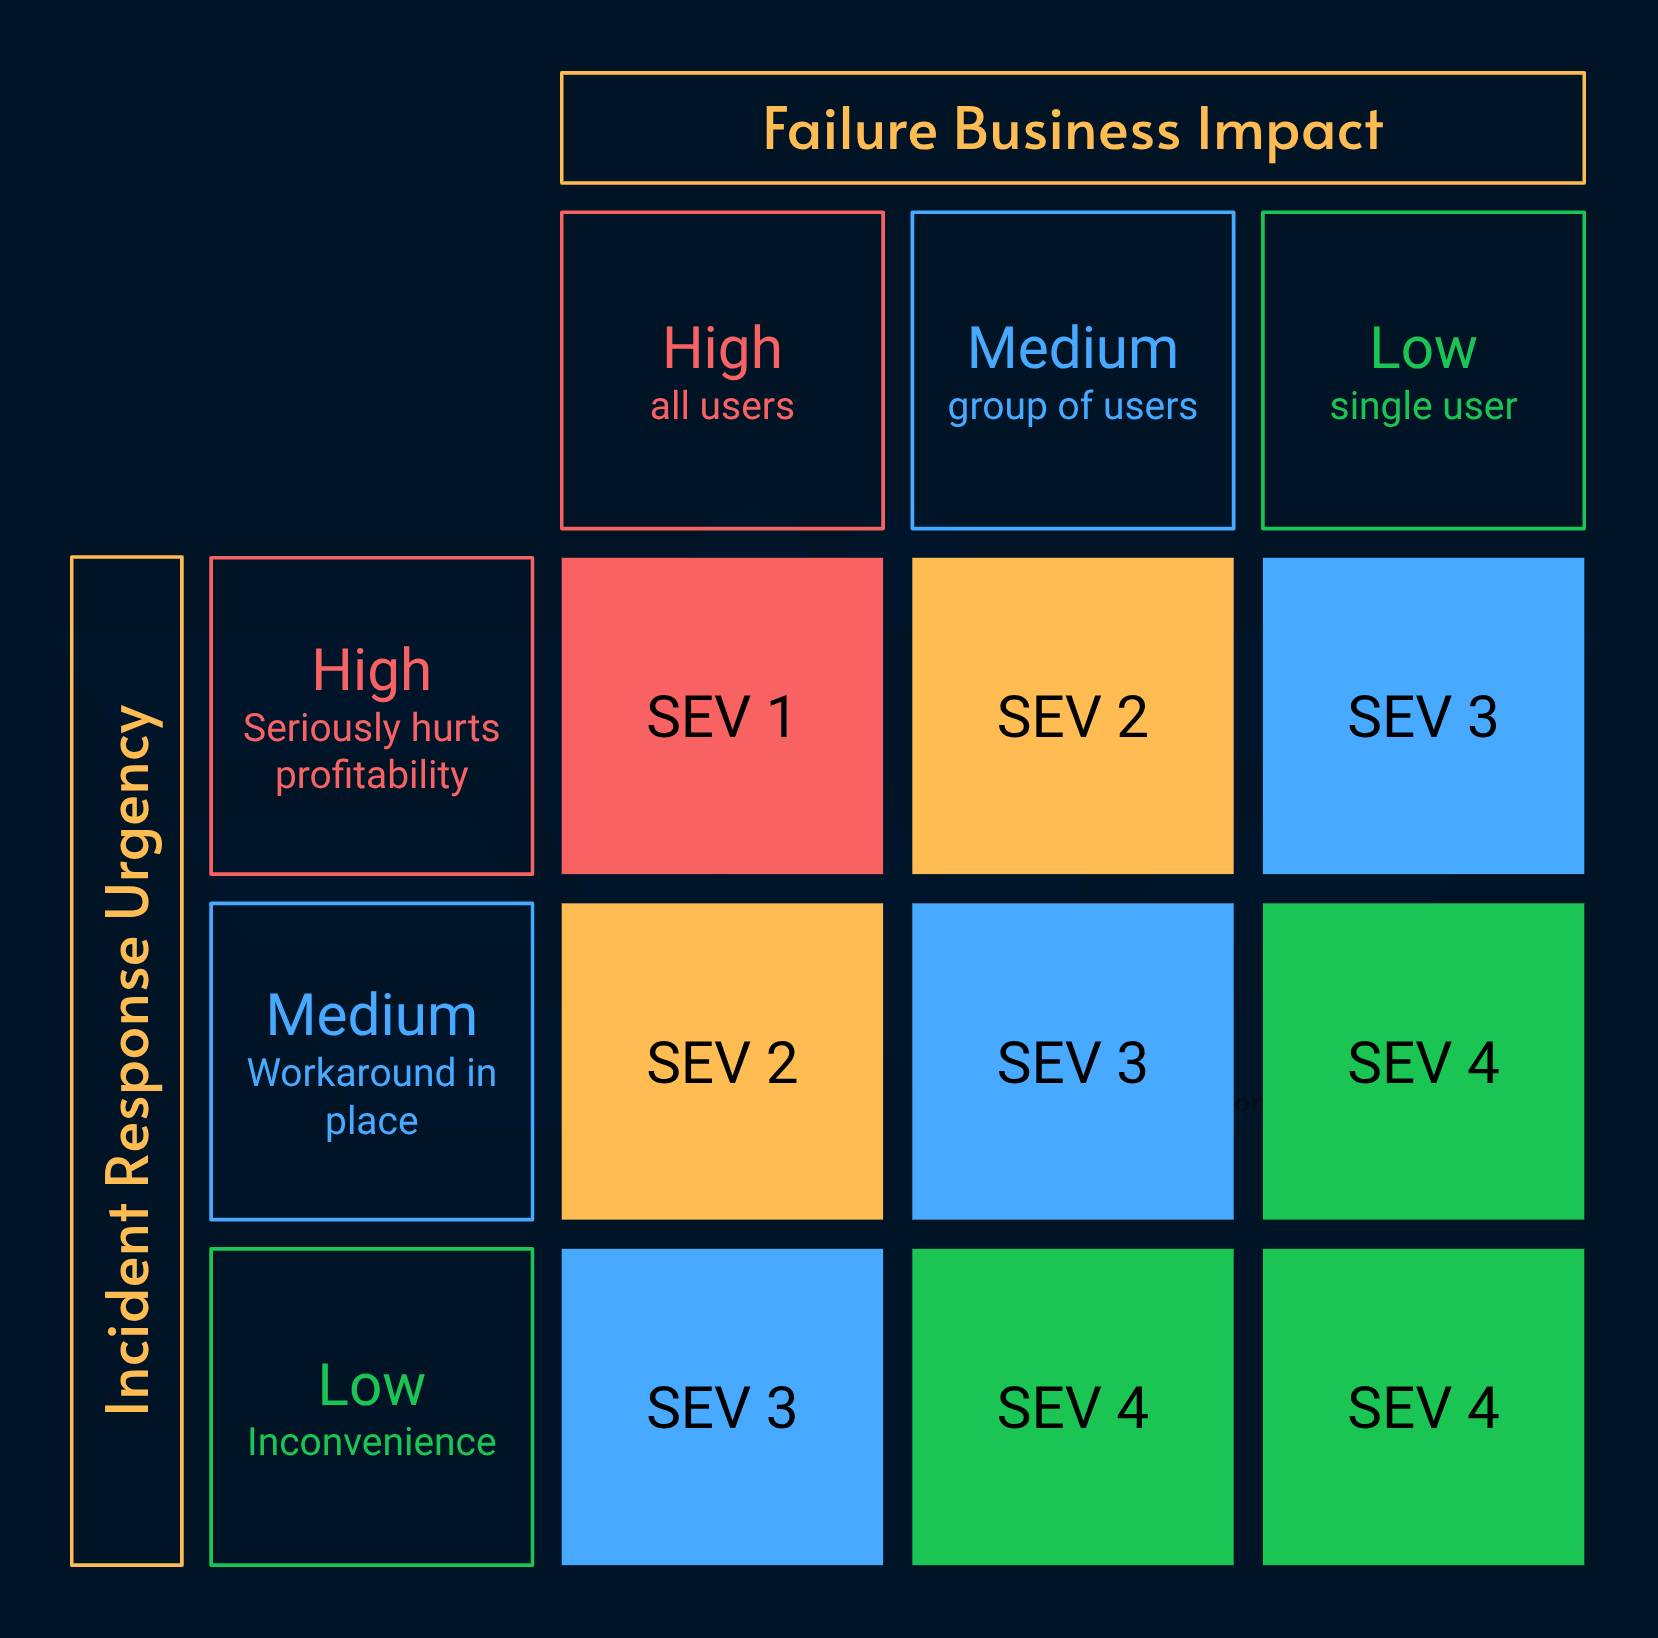
Incident severity levels, however, tie urgency to the business impact. One of the reasons is because the severity table is used during triage to prioritize manual work.
In the context of SLI, error budget burn rate takes care of connecting alerts to our SLO commitments.
Recap
SLIs are the base of the service level modeling. They give a focus to optimization while helping implement full ownership.
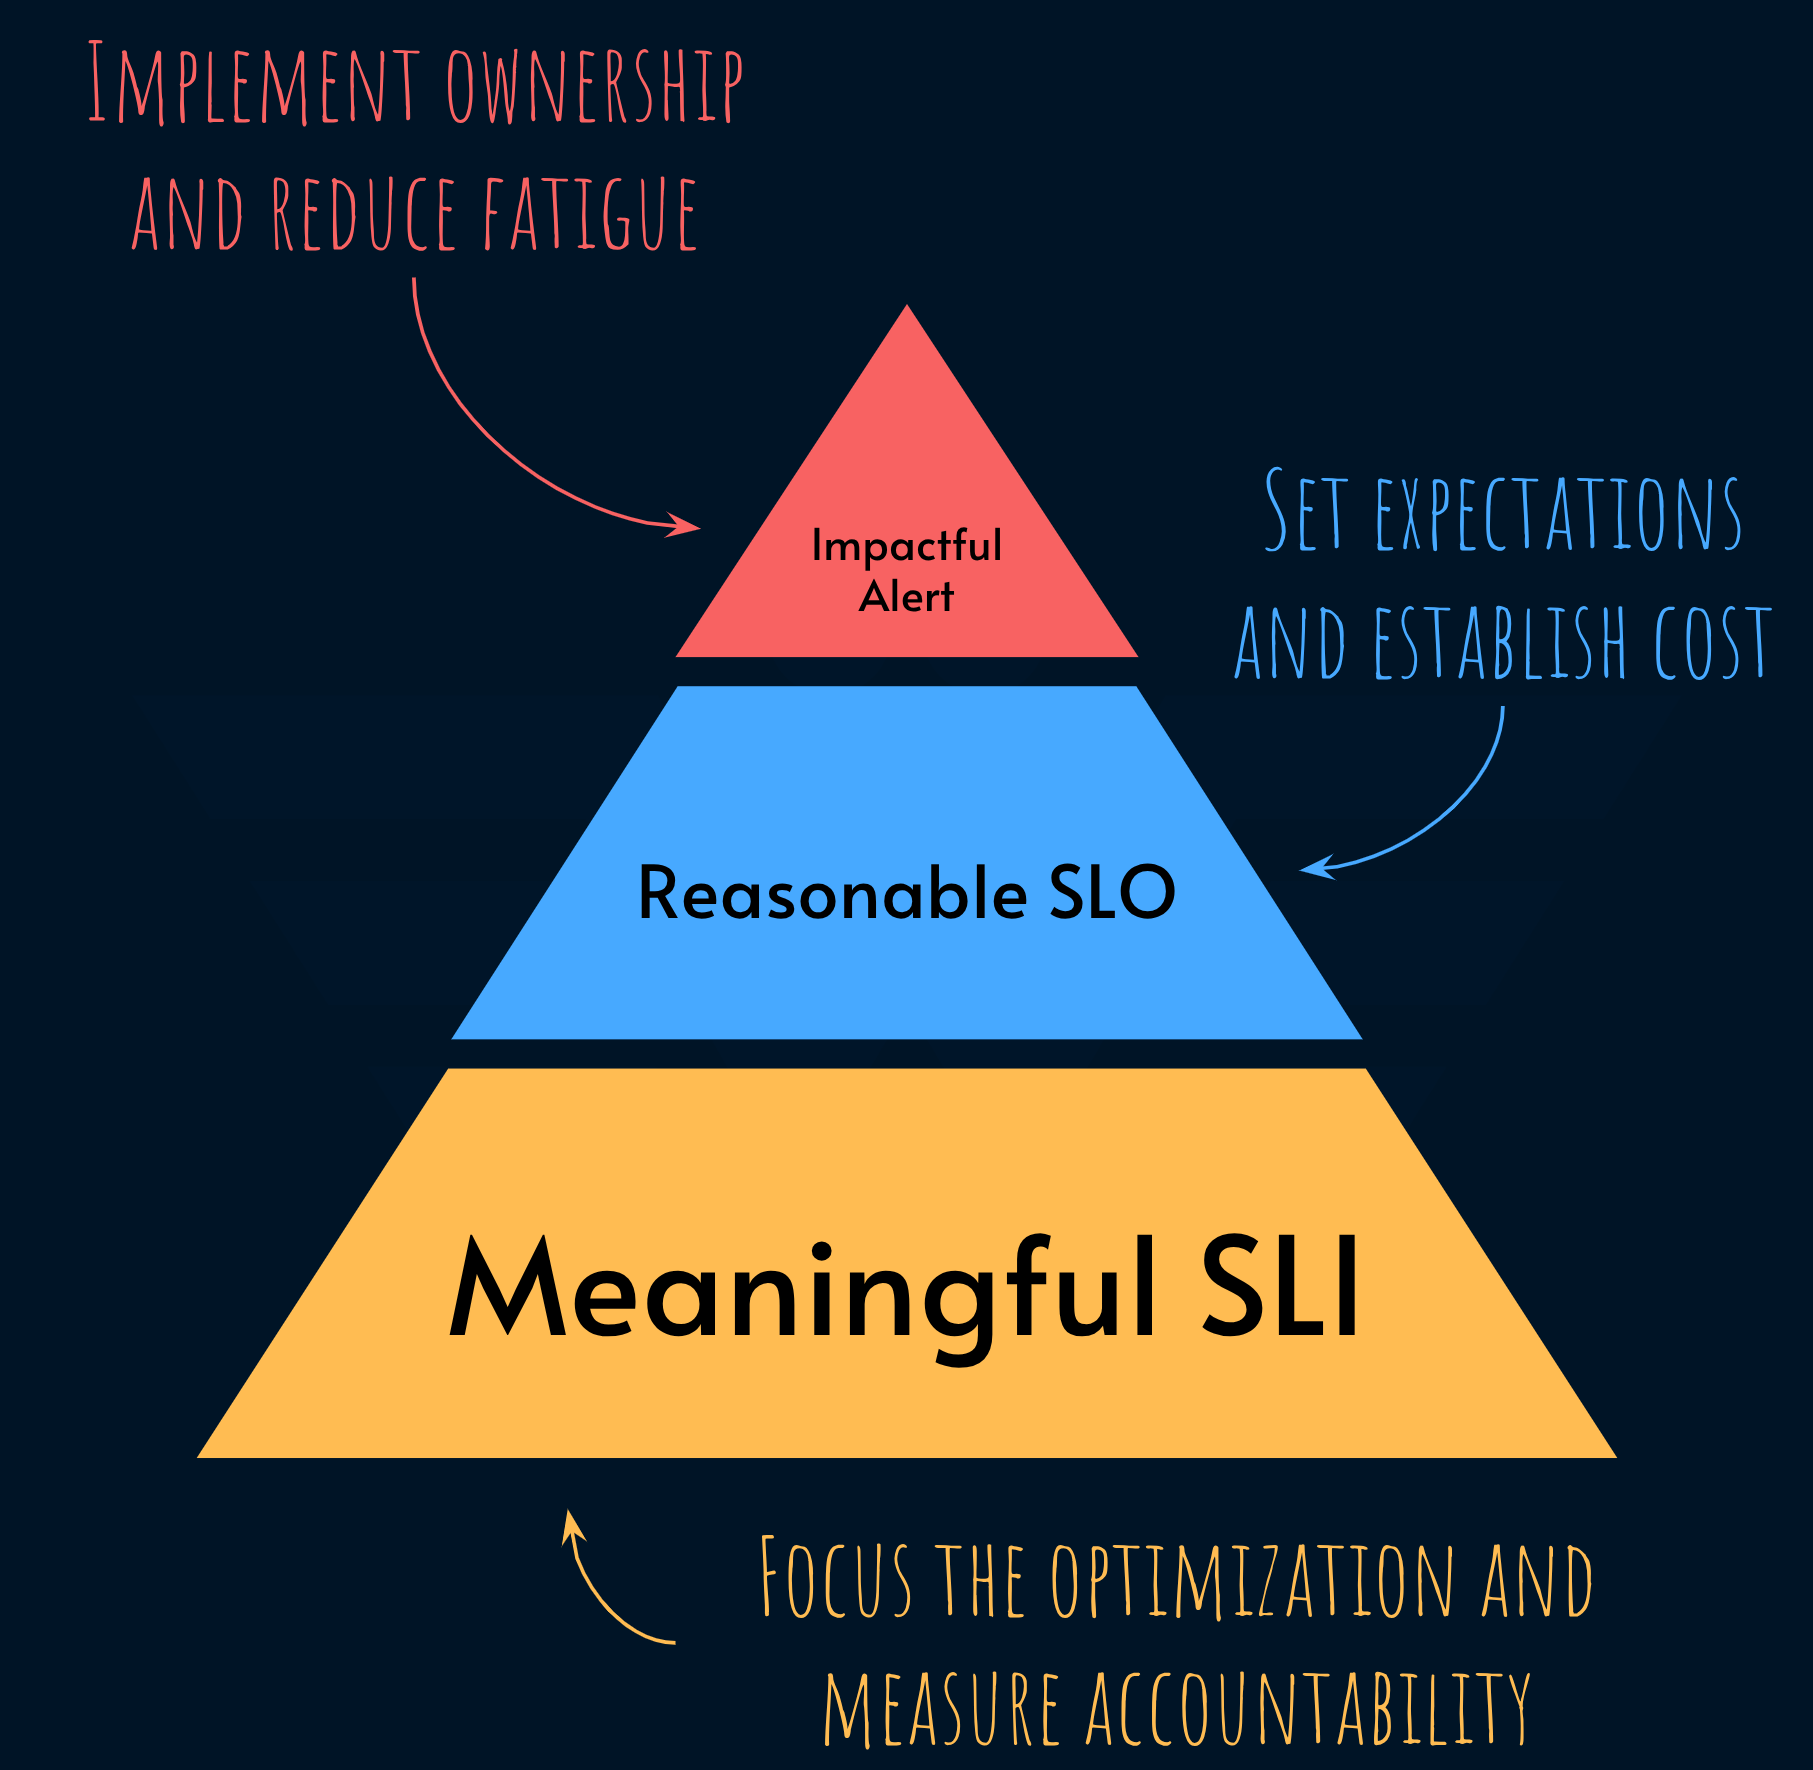
Good SLIs connect quantify the service from its consumer’s perspective. Great SLIs tie that to the business impact.
A good SLI is worth being on-call for whether 24/7 or just during working hours.
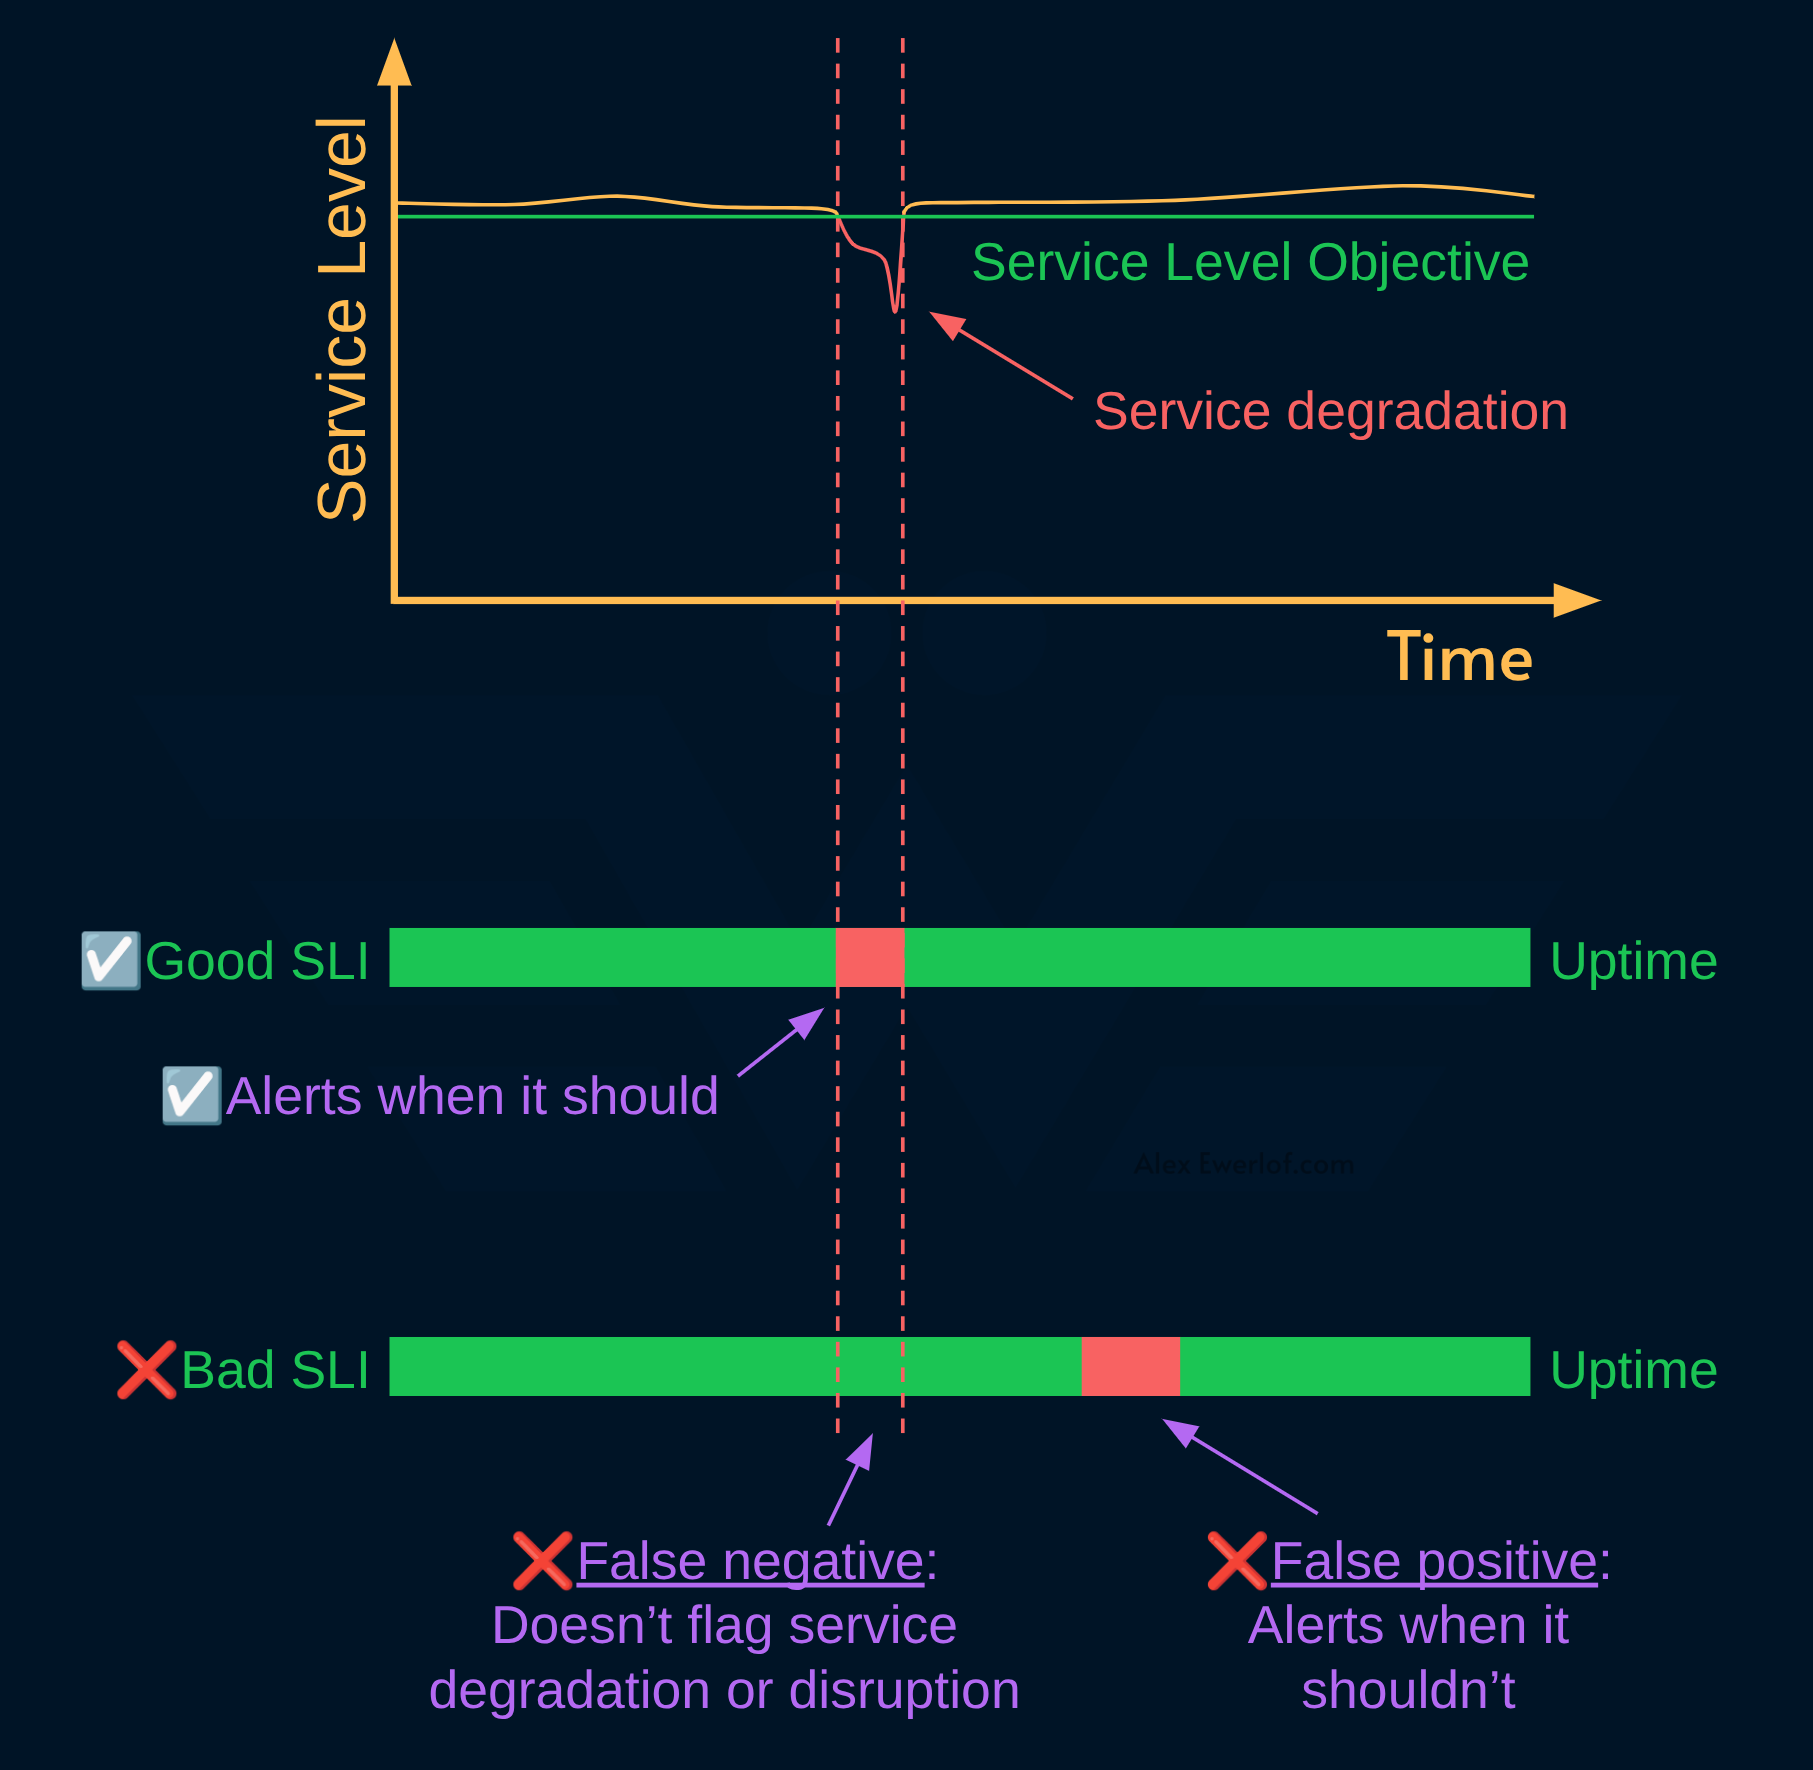
That’s because they have a good signal/noise ratio and can accurately flag service degradation or disruption.

Tasks shape the consumer journeys which can be expressed as a flow diagram for how a consumer uses one or more services to achieve their goals.
Read more about the service topology graph here:

Connecting these dots is one of the advantages of service level modeling. Done right, service levels can turn code monkeys to problem solvers by connecting technical solutions to problems that the business monetizes.
SLI compass is a complementary mental model that helps you assess the value of existing SLIs and decide a direction for evolving your measurement. You can check it out here:

My monetization strategy is to give away most content for free but hese posts take anywhere from a few hours to a few days to draft, edit, research, illustrate, and publish. I pull these hours from my private time, vacation days and weekends. The simplest way to support this work is to like, subscribe and share it. If you really want to support me lifting our community, you can consider a paid subscription. If you want to save, you can get 20% off via this link. As a token of appreciation, subscribers get full access to the Pro-Tips sections and my online book Reliability Engineering Mindset. Your contribution also funds my open-source products like Service Level Calculator. You can also invite your friends to gain free access.
And to those of you who support me already, thank you for sponsoring this content for the others. 🙌 If you have questions or feedback, or you want me to dig deeper into something, please let me know in the comments.