SLI vs KPI
Is Service Level Indicator (SLI) the same as Key Performance Indicator (KPI)?
I get this question a lot: is Service Level Indicator (SLI) the same as Key Performance Indicator (KPI)?
It depends! 🤓
Just joking. 😄There are many similarities but also some important nuances that this article digs into.
Does it really matter to distinguish between the two? Well, that one actually depends!!! If the point of the language is to communicate ideas, it pays dividends to use the right word.
Both SLI and KPI got popularized by Google although they don’t originate there. SLI and KPI are metrics where the “I” stands for indicator. Both metrics aim towards optimizing an objective and support data-driven decisions.
But that’s where the similarities end. There are fundamental differences between the two that stem from their purpose and expand to their scope, concern, audience, actions, and even formula.
What’s interesting is that KPI/OKR and SLI/SLO are two systems that can be converted to each other with many nuances.
Usage
Key Performance Indicators enjoy a large usage across business, sales, marketing, product, finance, and beyond.
KPIs cover various areas, including financial metrics (e.g. revenue per customer), product metrics (e.g. monthly active users), customer satisfaction, employee productivity, operational efficiency (e.g. number of goods produced without defects), culture (e.g. OfficeVibe scores), etc.
The target of KPIs can be to optimize systems, organizations, products, business, etc.
Service Level Indicator on the other hand is primarily concerned with reliability engineering and has seen an uptake due to the popularity of SRE (site reliability engineering) in recent years.
SLI covers various services metrics like latency, error rate, throughput, data consistency, cache hit ratio, etc.
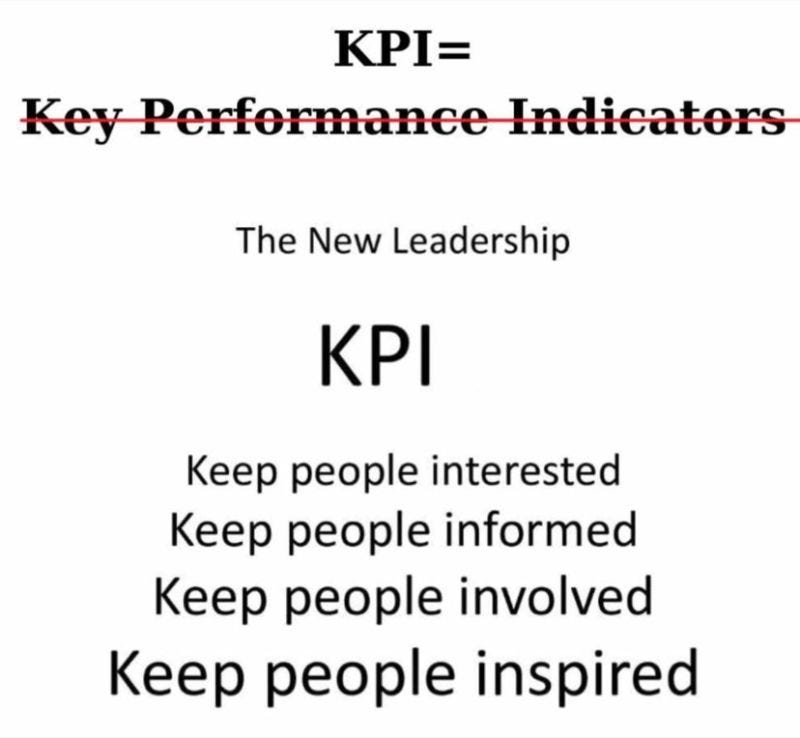
In my experience KPIs are more high level and wishy washy leading to memes like this:
SLI on the other hand typically enjoys a more formal definition and scoped usage (reliability engineering).
Normalization
KPI does not need to be normalized. The metric datapoints can be any number. For example, the monthly active users (MAU).
SLI doesn’t need to be normalized either. But it usually is:
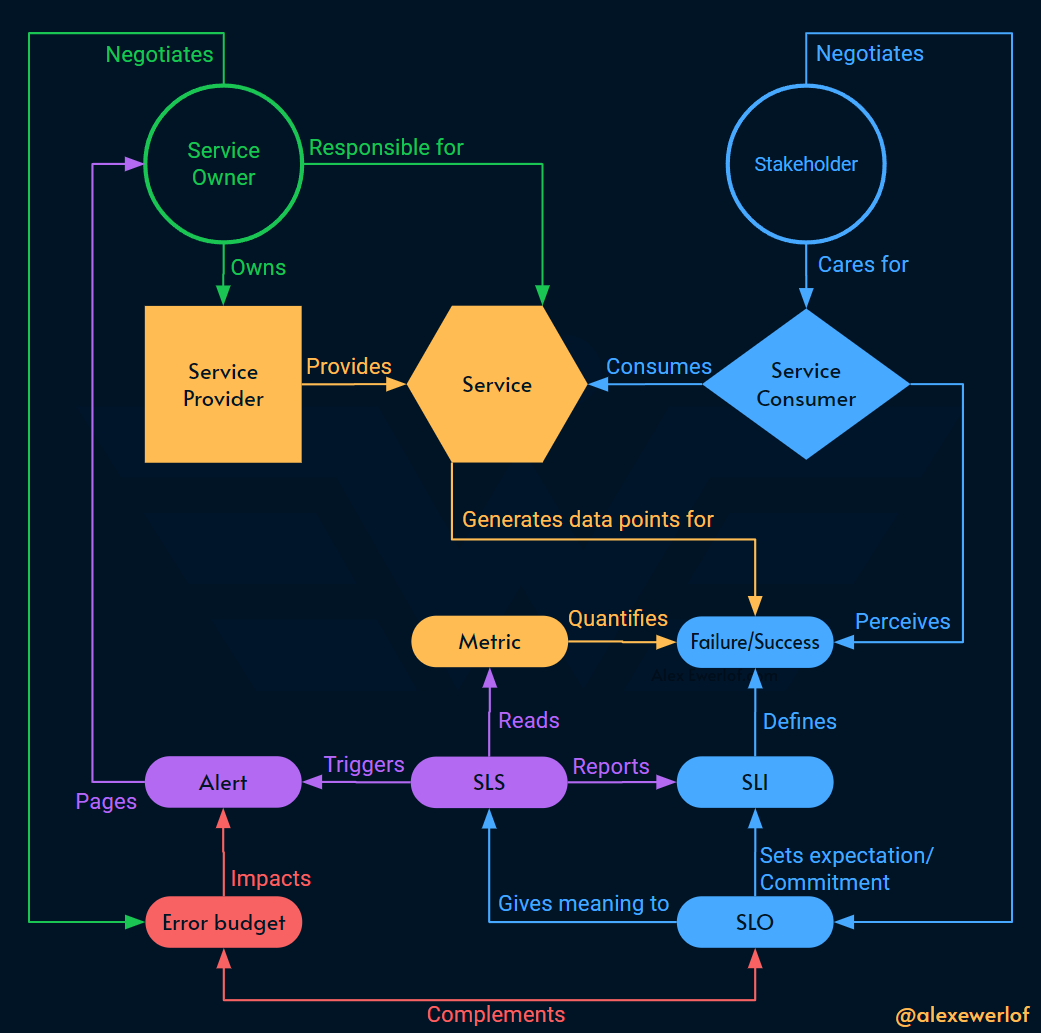
This normalization makes it much easier to assess the Service Level Status (SLS) against the Service Level Objective (SLO) which are both values between 0 to 100.
Objective
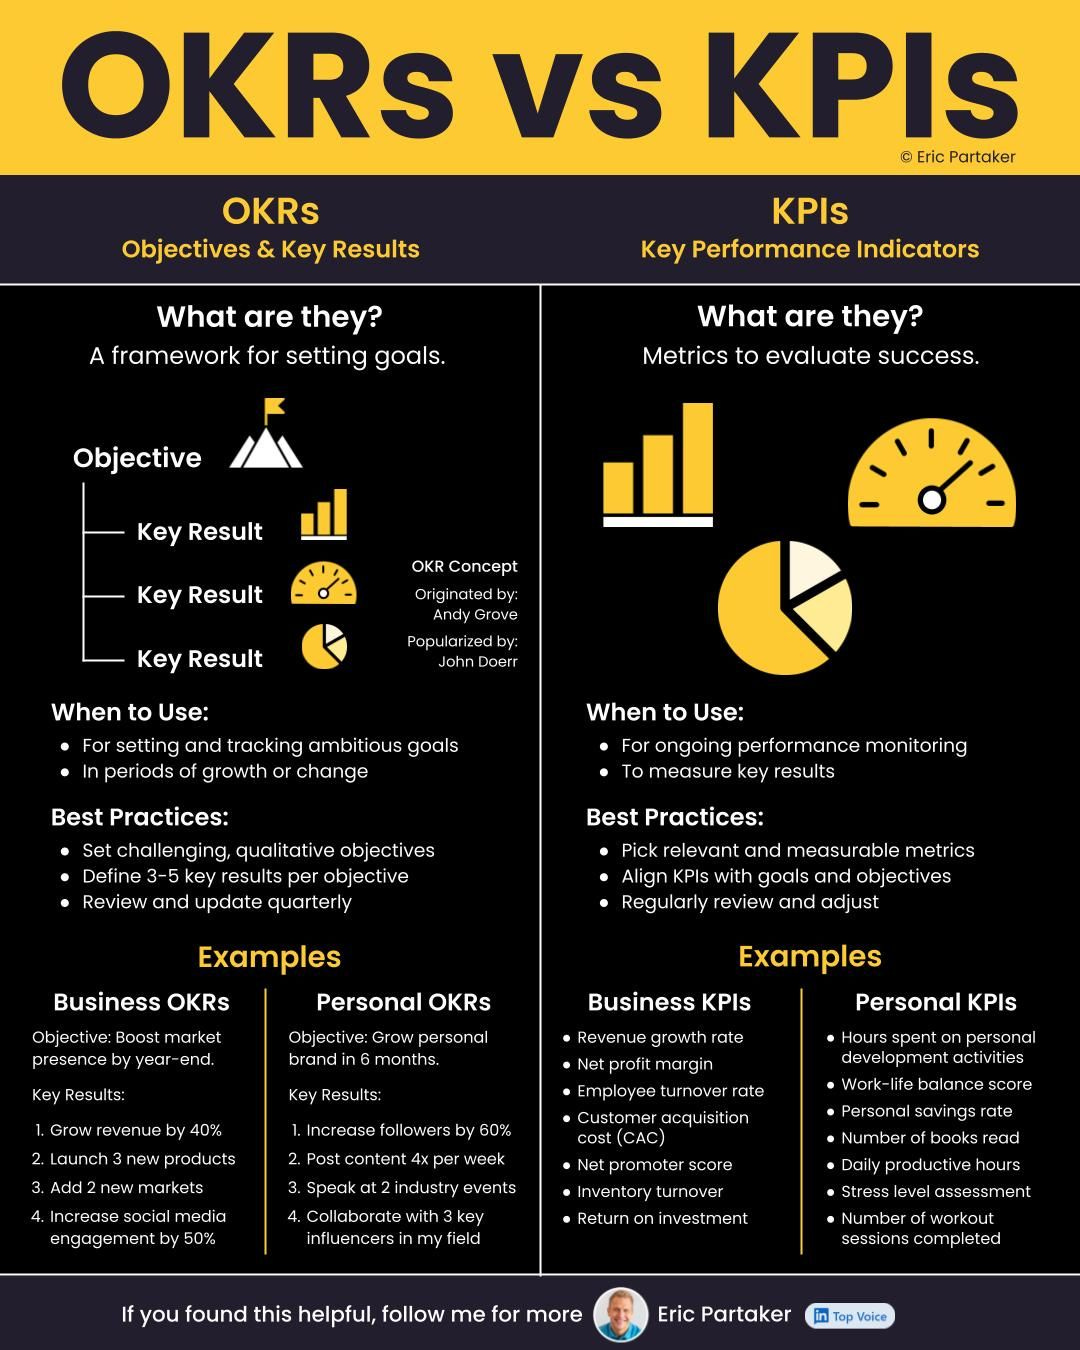
KPI is often used in combination with OKR (objectives and key results). For example:
OKR
Objective: Increase Monthly Active Users (MAU)
Key results within the next quarter
Increase new user sign-ups by 20%
Improve user retention rate from 60% to 75%
Reduce user churn rate by 15%
KPI
User sign-ups
User retention rate
User churn rate
One important point to call out is that OKRs are often ambitious. They shoot for the stars, aim for the moon. Even if you miss an OKR, you may still celebrate an improvement. 🎉
This is in stark contrast with how SLOs work. The mantra for SLO is to under promise and overdeliver. 🔨
Example: say an SLO commits to 99% of requests in 28 days be responded without errors over a period of 28 days.
If we got 213M requests in that period, at least 210,870,000 requests should be responded to with no error (this number is the Service Level Status in a given period).
Note that any higher number is fine (e.g. 212M) but lower (e.g. 200M) means that the SLO is breached.
Accountability
Both metrics have a notion of accountability. Although in my experience KPI and OKR are usually hard to implement in a way that drives action and is present on a day-to-day basis at the leaf nodes of the organization tree. They’re primarily used by upper and middle management to align key performance metrics.
SLI on the other hand, gets its meaning from the SLO that sets the minimum expectation.
A good SLO should be tied to alerting so that the service owner gets to action as soon as the service level is degraded.

Moreover, a good SLI measures only what is owned by the service owner and nothing more. In fact, you should never be responsible for what is out of your control.
On the other hand, KPIs tend to measure the performance of a larger organization unit (e.g. a cluster of teams) which makes them harder to trace to an individual or service. The notion of ownership is not as granular.
Time Horizon
KPI/OKR is generally concerned with a longer time horizon. Usually, this time span is a quarter of the year. As a result, even if the KPI is not performing too well, the organization waits till the end of the quarter before a definitive assessment.
There’s also a risk that the org will be punished if the OKR is met too early: leadership may just move the goal post and set a more aggressive OKRs.
As a result, Parkinson’s law takes over:
Work expands so as to fill the time available for its completion —Parkinson’s law
SLI on the other hand has a shorter compliance period (also known as SLO window): typically, 30 days.
As we elaborated before, the length of this window directly impacts forgiveness. SLOs having a shorter window than OKRs means that they are less forgiving towards service level degradation and require quicker reactions, hence the alerting.
conclusion
Let’s recap what we’ve learned:
KPI: high level performance metrics with a wide range of applications. The keyword in KPI is performance.
SLI: concrete system reliability metrics. The keyword in SLI is service.
Now, here’s the kicker! SLI can be a KPI!

Let’s say your company sells an API (e.g. OpenAI API access) and charges the customers for every call.
In this scenario, there’s a business motivation to keep the API available as much as possible because downtime directly hurts that business model.
OKR
Objective: keep the system availability high
Key Results over the next quarter:
Achieve 99.95% API availability
Reduce average response time to under 200ms
Decrease the number of critical incidents by 30%
KPI
Percentage of time the API is available and functioning correctly.
Time taken for the API to respond to requests.
Count of significant incidents impacting API availability.
Turning the OKR/KPI to SLI/SLO we get:
SLI: Time-Based Availability. SLO: 99.95% over 30 days
SLI: Event-Based Latency. SLO: 95% of request latencies should be less than 200ms
SLI: Event-Based non-critical incidents. SLO: 90% of incidents over the past 90 days are not critical
Note that I used several assumptions that were not stated in the OKR or KPI:
Availability SLI is calculated over 30 days instead of the 90 days that was stated in OKR (to motivate quicker reaction)
We used a 95% objective out of nowhere! Maybe that’s where the current SLS is at. Maybe it’s coming from the SLA. Instead of average, we replied on the notion of percentile which is embedded in the SLI/SLO formula.
Currently 60% of incidents are non-critical (baseline wasn’t stated)
And that’s the point! SLI/SLO are usually more detailed, normalized, and stricter towards failure.
Any KPI can be converted to SLI by adding the missing details, but there’s no guarantee that it’ll be desired by the audience or whether it makes sense.
You can also convert any SLI to a KPI by removing details and making it more friendly to a non-technical audience.
Finally, I just want to leave you with an important point: an SLO that is not tied to alerting is just an OKR! That’s because SLO is supposed to tie to accountability of the service owners and alerting is the absolute basic level to implement that accountability.
My monetization strategy is to give away most content for free. However, these posts take anywhere from a few hours to a few days to draft, edit, research, illustrate, and publish. I pull these hours from my private time, vacation days and weekends.
You can support me by sparing a few bucks for a paid subscription. As a token of appreciation, you get access to the Pro-Tips sections as well as my online book Reliability Engineering Mindset. Right now, you can get 20% off via this link. You can also invite your friends to gain free access.


Our organization has been pushing Paulo Caroli's https://martinfowler.com/articles/team-okr.html and I would dearly love to know how to translate better from more empirical measurements of business health like SLIs to the terms that it appears they are looking for.